Figures & data
Figure 1 Cystoscopic visualizations of the patient. (A) Initial cystoscopy showing large cell neuroendocrine carcinoma within the bladder. (B) Posttreatment visualization indicating local scar tissue formation following comprehensive treatment, including TURBT, secondary resection, chemotherapy, and radiotherapy. (C and D) Comparative cystoscopy images captured before and after electrocauterization of the bladder scar tissue one year after TURBT.
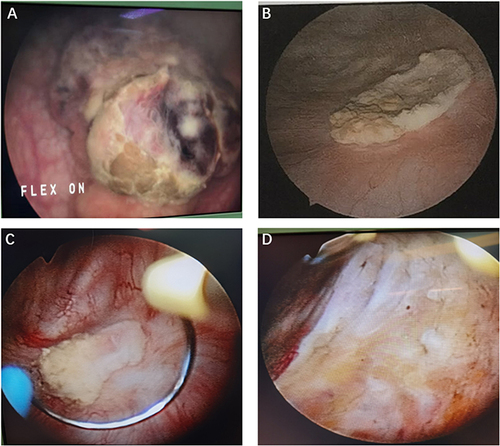
Figure 2 Radiological Imaging of the Patient. (A) Axial CTU view. (B) Sagittal CTU projection. (C) Coronal CTU image. CT urography revealed a nodular soft tissue mass measuring approximately 2.1 cm × 2.0 cm × 2.1 cm on the bladder’s left posterior wall, with surface calcification and mild to moderate enhancement following contrast agent administration. (D) Axial MR image. (E) Sagittal MR image. (F) Coronal MR image. MRI scans display heterogeneous signal intensities within the bladder lesion, with isointense T1 and slightly hyperintense T2 signals.
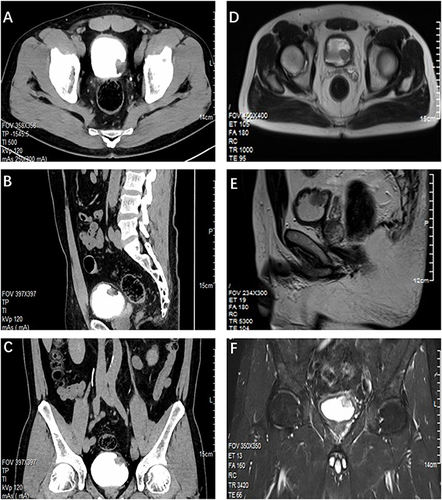
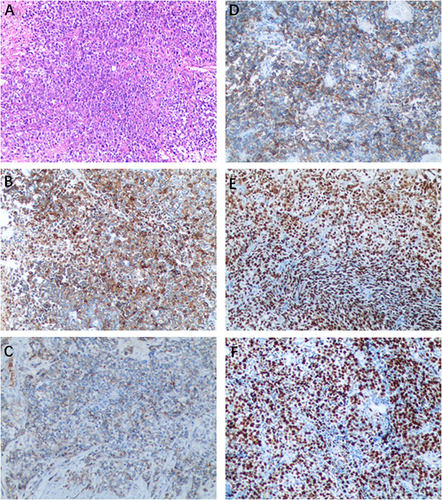
Figure 3 Histopathological and immunohistochemical staining of the tumor. (A) LCNEC of the bladder showed large cells with large nuclear size, prominent nucleoli, and abundant cytoplasm. (H&E staining, ×100). (B) The neoplasm displayed positive expression of Synaptophysin. (C) The neoplasm displayed positive expression of CgA. (D) Positive for CD56. (E) Positive for GATA3. (F) High proliferative index with Ki67 at 80%.