Figures & data
Table 1 Exact values of μG(n), σG(n), μU(n), σU(n), and in two dimensions
Table 2 Exact values of μG(n), σG(n), μU(n), σU(n), and in three dimensions
Figure 1 Plot of the characteristic ratio vs the number of bonds in PE with LJP at 1,080 K for uniform and GSAW distributions.
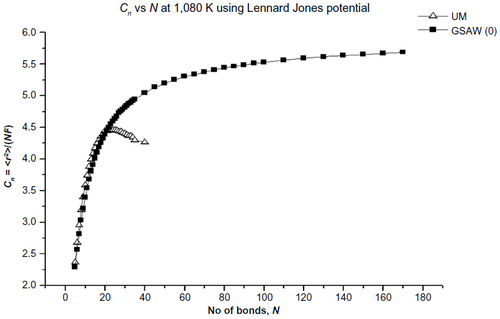
Figure 2 Plot of the characteristic ratio vs the number of bonds in PE with Kihara potential at 1,000 K for uniform and GSAW distributions.
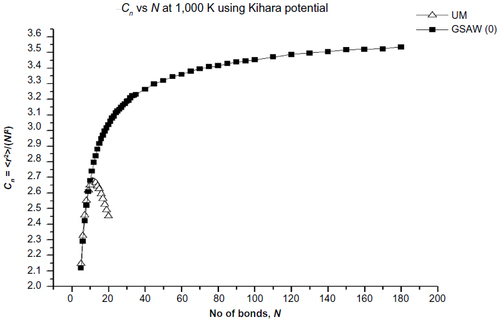
Figure 3 Plot of the characteristic ratio vs the number of bonds in PE with Kihara potential at 413 K for uniform and GSAW distributions.
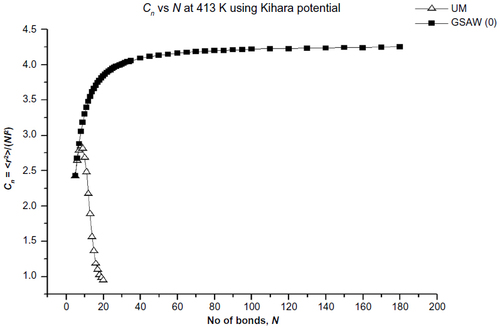
Figure 4 Plot of the characteristic ratio vs the number of bonds in PE with Kihara potential at 298 K for uniform and GSAW distributions.
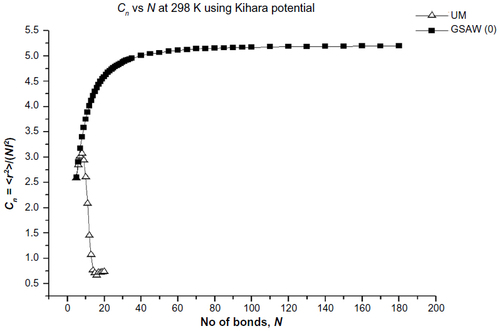
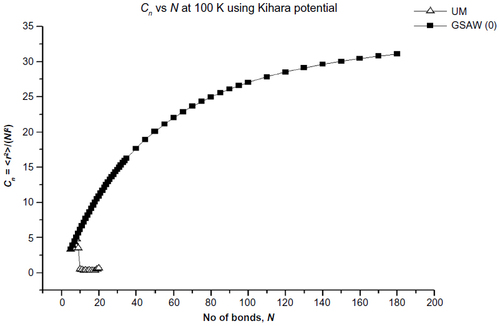
Figure 5 Plot of the characteristic ratio vs the number of bonds in PE with Kihara potential at 100 K for uniform and GSAW distributions.