Figures & data
Figure 1 PRISMA flow diagram.
Abbreviation: PRISMA, Preferred Reporting Items for Systematic Reviews and Meta-Analyses.
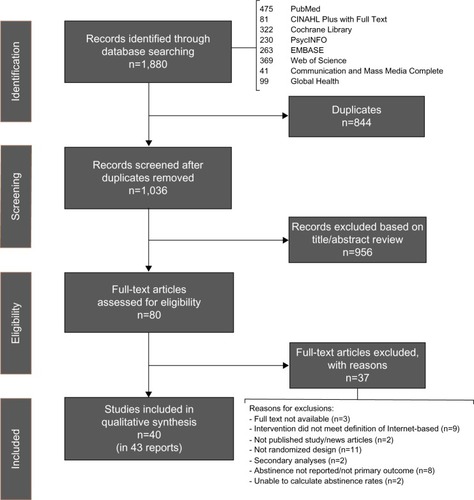
Figure 2 (A) Risk of bias summary; (B) risk of bias graph.
Notes: “+” = low risk of bias; “−” = high risk of bias; “?” = unclear risk of bias.
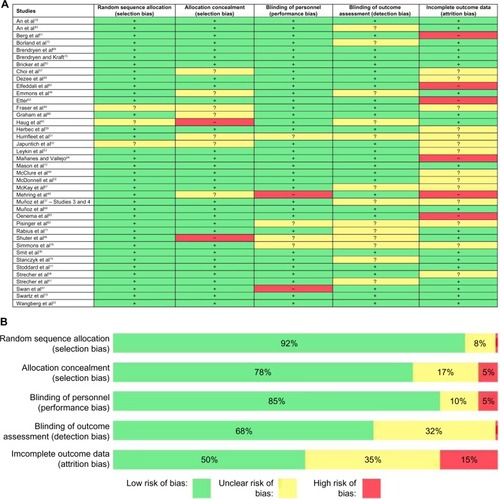
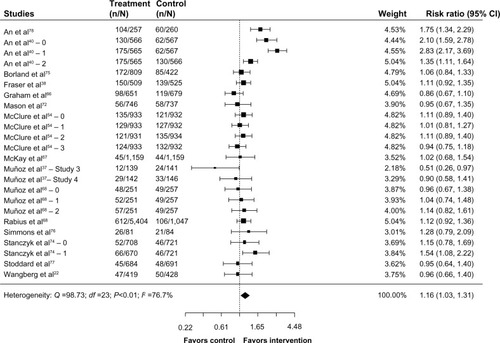
Figure 3 Internet interventions compared to assessment-only/waitlist control.
Abbreviation: CI, confidence interval.
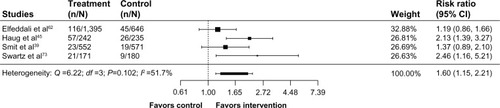
Figure 4 Static Internet interventions compared to self-help print materials.
Abbreviation: CI, confidence interval.
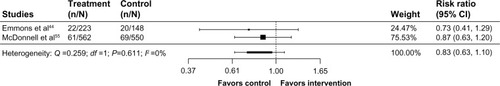
Figure 5 Interactive Internet interventions compared to self-help print materials.
Abbreviation: CI, confidence interval.
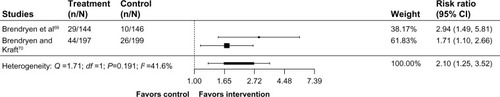
Figure 6 Internet interventions compared to face-to-face intervention.
Abbreviation: CI, confidence interval.
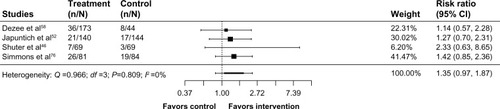
Figure 7 Internet interventions compared to telephone counseling.
Abbreviation: CI, confidence interval.
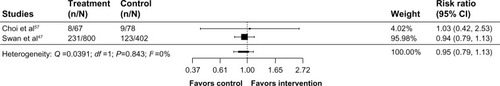
Figure 8 Internet interventions compared to other websites.
Notes: Comparisons are as follows: An et alCitation40: 0, personally tailored health information vs general lifestyle content; 1, personally tailored health information + peer coaching vs general lifestyle content; 2, personally tailored health information + peer coaching vs personally tailored health information. Fraser et alCitation38: Smokefree.gov vs “lite” version of website. McClure et alCitation54: 0, message tone (motivational/prescriptive); 1, testimonials (yes/no); 2, navigation (autonomous vs dictated); 3, email prompts (yes/no). Muñoz et alCitation68: 0, static website + email vs static website; 1, static website + email + mood management; 2, static website + email + mood management + bulletin board vs static website. Stanczyk et alCitation74: 0, tailored text-based website vs generic website; 1, tailored video-based website vs generic website.
Abbreviation: CI, confidence interval.
Abbreviation: CI, confidence interval.