
Figures & data
Figure 1 ODs in Geisinger service area.
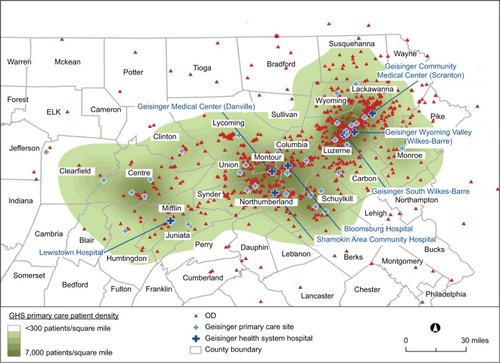
Table 1 Study demographic and outcome variables among patients with one or more ODs (N=2,039)
Figure 2 Study age distribution among patients with one or more ODs.
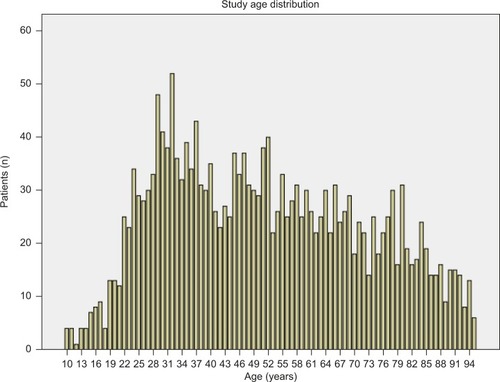
Table 2 Significant bivariate results (P<0.01) for patient deaths within 1 year post-OD among patients with one or more ODs (N=2,039)
Table 3 Significant multiple logistic regression results (P<0.01) for patient deaths 1 year post-OD among patients with one or more ODs (N=2,039)
Table 4 Significant multiple logistic regression results (P<0.01) for multiple OD events among patients with one or more OD (N=2,039)
Table 5 Significant multiple logistic regression results (P<0.01) for high number of outpatient visits (75th percentile) 1 year post-OD among patients with one or more ODs (N=2,039)
Table 6 Significant multiple logistic regression results (P<0.01) for high total costs (75th percentile) 1 year post-OD among patients with one or more ODs (N=2,039)