
Figures & data
Figure 1 Age-specific psychotropic drug-related deaths (n=133).
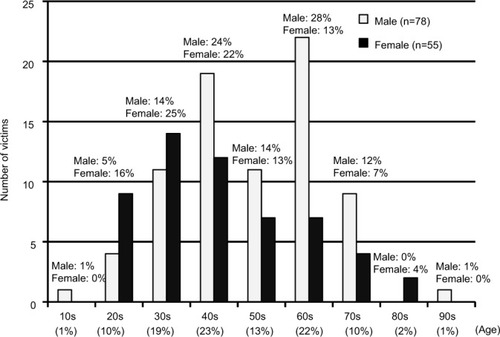
Figure 2 Ratio of government welfare-payment recipients to the total number of unemployed individuals.
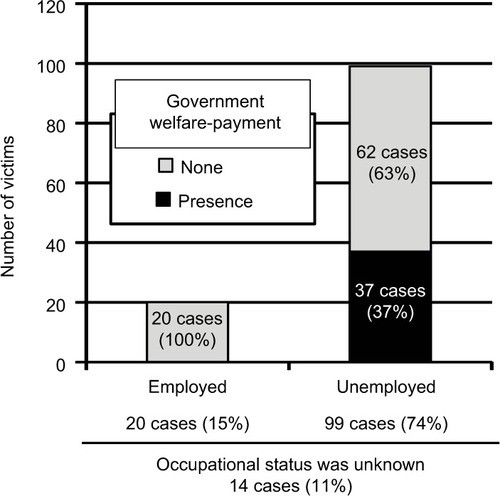
Table 1 Study items with regard to psychotropic drug-related deaths
Figure 3 Causes of death related to psychotropic drug administration.
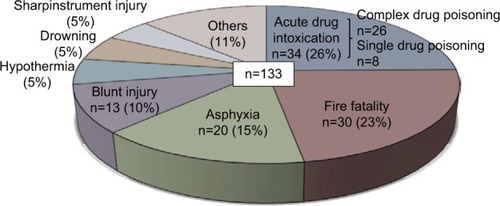
Figure 4 Underlying disease identified on performing autopsy in cases of psychotropic drug-related deaths.
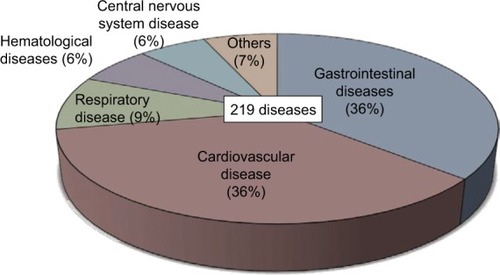
Table 2 Detected drug concentrations in Schedules III and IV in the “Convention on Psychotropic Substances”
Table 3 Detected drug concentrations except for those in Schedules III and IV in the “Convention on Psychotropic Substances”
Table 4 Blood alcohol concentrations in cases of psychotropic drug-related deaths (postmortem period<48 hours)
Table S1 Causes of death related to psychotropic drugs
Table S2 Underlying disease identified based on performing autopsies in cases of psychotropic drug-related deaths
Table S3 Compound drug detection and number of cases