
Figures & data
Figure 1 Estimated diagnoses of HIV infection, by age, 2011, United States.
Note: Figure reproduced from Centers for Disease Control and Prevention. Centers for Disease Control and Prevention. HIV among older Americans. Atlanta, GA: Centers for Disease Control and Prevention; 2013. Available from: http://www.cdc.gov/hiv/pdf/library_factsheet_HIV_%20AmongOlderAmericans.pdf. Accessed April 10, 2015.Citation7
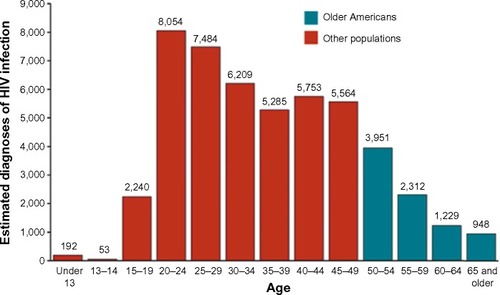
Table 1 Diagnoses of HIV infection among adults aged 50 years and older by age at diagnosis (years) and race ethnicity
Figure 2 Search strategy.
Notes: Search was performed using Ovid MEDLINE. *Choose “Focus” (rather than “Explode”) and choose “Include All Subheadings” (options available in Ovid MEDLINE). “Focus” refers to including most relevant references. “Explode” refers to including references that are only marginally relevant to the topic selected (in addition to those most relevant); #references to studies of non-US populations were excluded manually, leading to the exclusion of 53 references (129−53=76). Most of the excluded references referred to studies of samples in the People’s Republic of China, Brazil, and Western Europe.
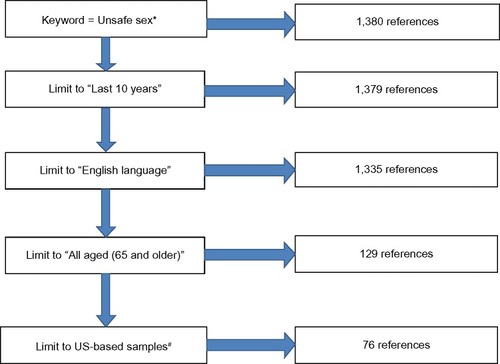
Figure 3 Estimated diagnoses of HIV infection among adults aged 50 and older by sex and transmission category, 2010, 46 states.
Notes:
‡Other transmission risk factors include hemophilia, blood transfusion, and risk factors not reported or identified; *heterosexual contact with a person known to have or be at high risk for, HIV infection. Due to rounding, percentages may not add up to 100%. Figure reproduced from Centers for Disease Control and Prevention. HIV Among Older Americans. Atlanta, GA: Centers for Disease Control and Prevention; 2013. Available from: http://www.cdc.gov/hiv/risk/age/olderamericans/. Accessed: October 15, 2014.Citation73
Abbreviation: IDU, injection drug use.
Abbreviation: IDU, injection drug use.
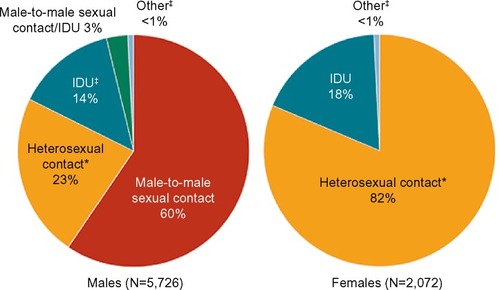
Table 2 Sexual risk behaviors among older Americans