Figures & data
Figure 1 Nestin expression in neural stem cells. Neural stem cells were plated and their stemness assessed using an antibody raised against the stem cell marker, nestin. a) and b) Three-month-old neural stem cells; c) and d) 20-month-old neural stem cells; a) and b) male neural stem cells; c) and d) female neural stem cells.
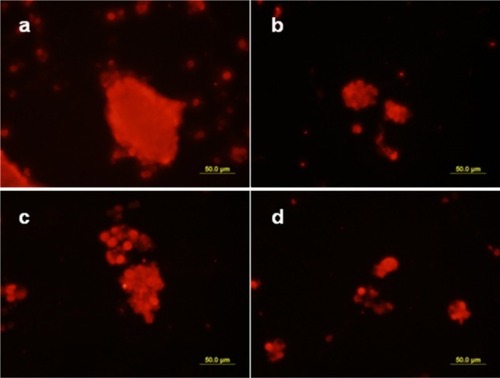
Figure 2 Retinoic acid-induced neural marker expression. Neural stem cells isolated from three- and 20-month-old male (open bars) and female (black bars) rats were grown as neurospheres in serum-free medium and treated with retinoic acid 1 μM for 10 days. Neurospheres were then harvested, the protein extracted, and the expression of neural fate-specific markers determined by Western blotting. a) βiii-tubulin, b) MAP2, c) gAP43, d) doublecortin, e) GFAP, and f) CNPase. On each gel, the three left lines represent the male samples and the three right lines represent the female samples. Statistical analyses were performed by Student’s t-test using the results obtained with neural stem cells isolated from three different rats for each sex.
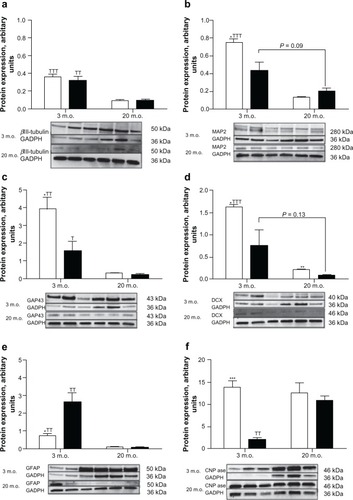
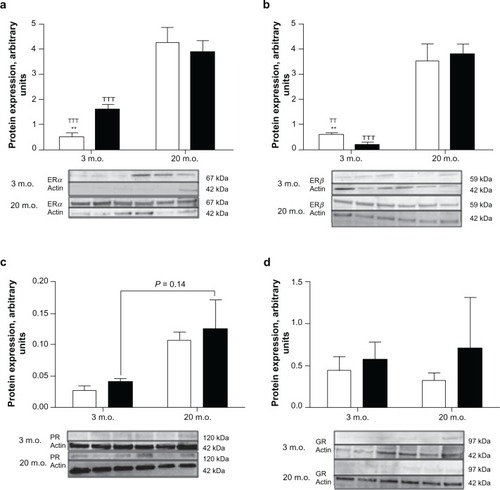
Figure 3 Steroid receptor expression in undifferentiated neural stem cells. Neural stem cells isolated from three- and 20-month-old male (open bars) and female (black bars) rats were grown as neurospheres in serum-free medium. Neurospheres were then harvested, protein extracted, and the expression of steroid receptors determined by Western blotting. On each gel, the three left lines represent the male samples and the three right lines represent the female samples. Statistical analyses were performed by Student’s t-test using the results obtained with neural stem cells isolated from three different rats for each sex.