Figures & data
Table 1 Experimental groups indicated by days and abbreviations
Table 2 Primer sequences and optimized annealing temperatures for the genes used for expression analysis
Figure 1 Expression of selected genes at different prenatal and postnatal stages observed through gel electrophoresis.
Notes: The difference in the width and brightness of band indicates the change in expression level. β-actin was used as an internal control. F14 and F17 are prenatal days, where F indicates fetus. The designators N1–N14 denote the postnatal days, where N indicates neonatal. Adult sample (coded as A) was used as control.
Abbreviations: E-cad, E-cadherin, ICAM, intracellular CAM; N-cad, N-cadherin.
Abbreviations: E-cad, E-cadherin, ICAM, intracellular CAM; N-cad, N-cadherin.
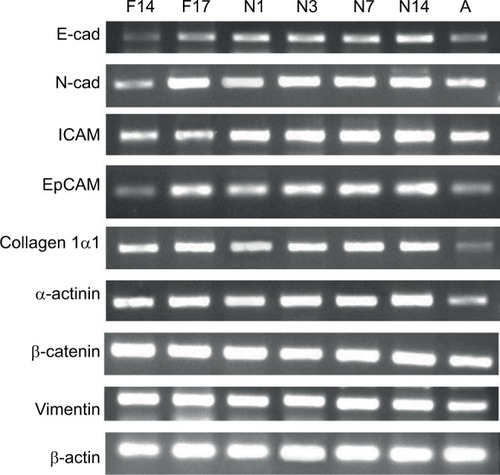
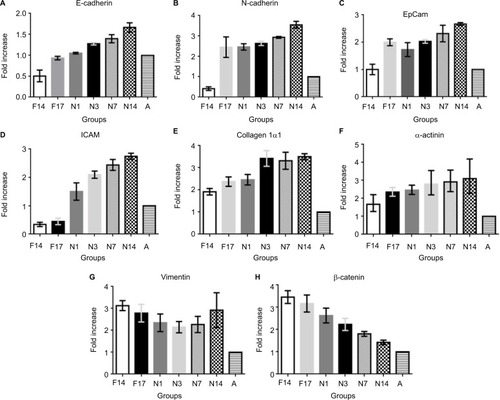
Figure 2 Real-time PCR analysis of selected genes at different prenatal and postnatal stages.
Notes: Fold increase in the expression of all selected genes is observed. (A) E-cadherin, (B) N-cadherin, (C) EpCAM, (D) ICAM, (E) collagen 1α1, (F) α-actinin, (G) vimentin and (H) β-catenin. Values are expressed as mean value ± SD. **P-value was statistically significant (P≤0.05). F14 and F17 are prenatal days, where F indicates fetus. The designators N1–N14 denote the postnatal days, where N indicates neonatal. Adult sample (coded as A) was used as control.
Abbreviations: ICAM, intracellular CAM; PCR, polymerase chain reaction.
Abbreviations: ICAM, intracellular CAM; PCR, polymerase chain reaction.