
Figures & data
Table 1 Structural indices of distal femur in the four groups analyzed by high-resolution peripheral quantitative computed tomography
Figure 1 Distal femur analyzed by high-resolution peripheral quantitative computed tomography compariing control (A) and treated groups of mesenchymal stem cells (B), osteoblasts (C), and exosomes (D).
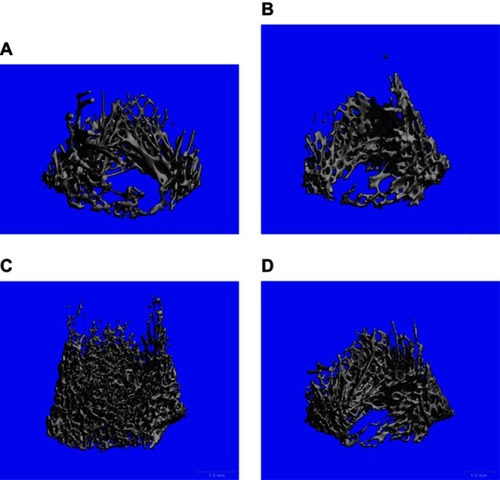
Figure 2 Sagittal sections of distal femur analyzed by high-resolution peripheral quantitative computed tomography compairing control (A) and treated groups of mesenchymal stem cells (B), osteoblasts (C), and exosomes (D).
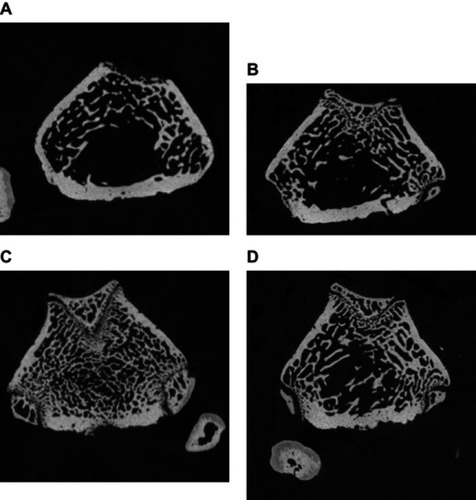
Table 2 Comparison between control versus MSCs for distal femur
Table 3 Comparison between control versus osteoblasts for distal femur
Table 4 Comparison between control versus exosomes for distal femur
Table 7 Comparison between control versus osteoblasts for spinal indices
Figure 3 Lumbar fourth vertebral body analyzed by high-resolution peripheral quantitative computed tomography compariing control (A) and treated groups of mesenchymal stem cells (B), osteoblasts (C), and exosomes (D).
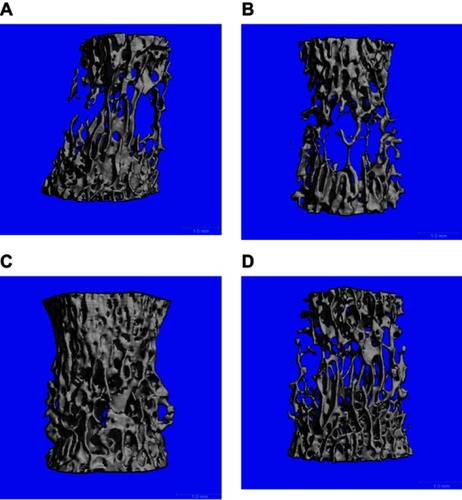
Table 5 Structural indices of spine in the four groups as analyzed by HRpQCT
Table 6 Comparison between control versus MSCs for spinal indices
Table 8 Comparison between control versus exosomes for spinal indices