Figures & data
Figure 1 Biological properties of Mesenchymal Stem Cells (MSCs) after different exposure time at Radiofrequency (RF) of 169MHz and relative positive control (PC). (A) Cell proliferation measured by Cell Counting Kit-8 24, 48 and 72 h after RF exposure. The graph shows the mean values ± SD (n=3, *p<0.05, **p<0.01). (B) The picture shows representative FACS analysis of MSCs after RF exposure. Experiments were conducted in triplicate for each condition. Percentages of different cell populations (G1, S, and G2/M) are indicated. Data are expressed with standard deviation (n=3* p<0.05, **p<0.01). (C) The picture shows representative microscopic fields of senescence-associated beta-galactosidase-positive cells (blue) under different experimental conditions. (D) The pictures show representative annexin-V analysis of MSCs after RF exposure for each condition. The assay allows the identification of early (Annexin V+ and 7-ADD–), late apoptosis (Annexin V+ and 7-ADD+) and necrotic cells (Annexin V– and 7-ADD +). (E) The histograms show the percentage of senescent cells in MSCs after RF exposure. Data are represented as mean ± standard deviation (SD) of three independent replicates (n=3, ± SD, **p<0.01). (F) The graph showed the percentage of early and late apoptotic cells. The experiments were conducted in triplicate for each condition (n=3, ± SD, **p<0.01).
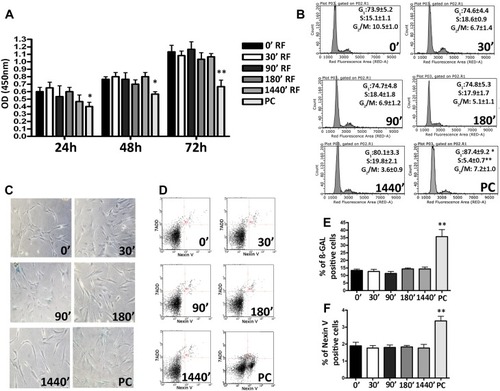
Figure 2 Stemness properties of Mesenchymal Stem Cells (MSCs) after Radiofrequency (RF) exposure. (A) The pictures show representative crystal violet staining of clones obtained after 14 days of incubation with MSCs following RF exposure. The mean number of clones per 1000 cells plated in 100 mm dish (± SD, n=3). (B) Microscope images of MSCs differentiated in: adipocyte evaluated by Oil Red O staining; osteocyte evaluated by Alizarin red S (ARS) staining and chondrocyte evaluated by Safranin O staining. (C) Histograms show expression levels of the mRNA of the gene as indicated. The mRNA levels were normalized to GAPDH mRNA expression, which was selected as an internal control. Data are expressed as arbitrary units with standard deviation (n=3).
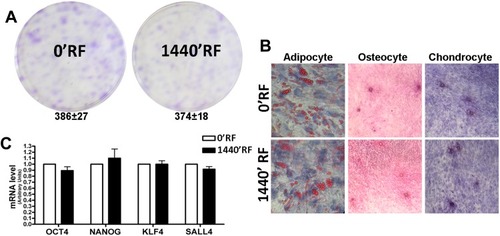
Figure 3 DNA damage and repair analysis. (A) Fluorescence photomicrographs show the merging of cells stained with anti-H2AX (green). Nuclei were counterstained with DAPI (blue). A representative microscopic field for each treatment is shown. (B) Graph shows the degree of H2AX phosphorylation. This was evaluated by counting the number of gamma-H2AX immunofluorescent foci per cell. Foci number was determined for 200 cells. Each dot represents an individual cell. Black bars indicate mean value for each category (n=3). (C) Fluorescence photomicrographs show typical cells stained with anti-ATM (green) and DAPI (Blue). A representative microscopic field for each treatment is shown. (D) The graph indicates the mean percentage of ATM-positive cells for each condition. The data are indicated with standard deviation (n=3). (E) Histograms show expression levels of the mRNA of the gene as indicated. The mRNA levels were normalized to GAPDH mRNA expression, which was selected as an internal control. Data are expressed as arbitrary units with standard deviation (n=3).
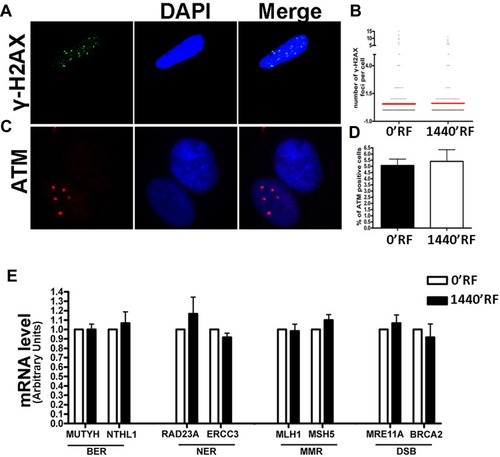
Figure 4 Effects of Radiofrequency (RF) exposure on cell cycle protein involved. (A) The panel shows the expression levels of several proteins following treatments of cells with RFs. GAPDH protein was used as a loading control. (B) The histogram shows the quantitative evaluation of Western blot bands in MSCs after RF exposure. The data are indicated as the mean expression values (±SD, n=3).
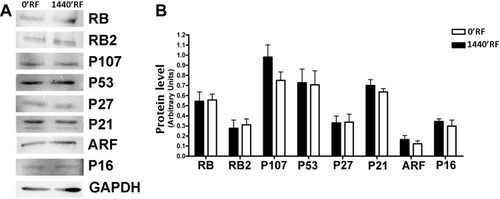
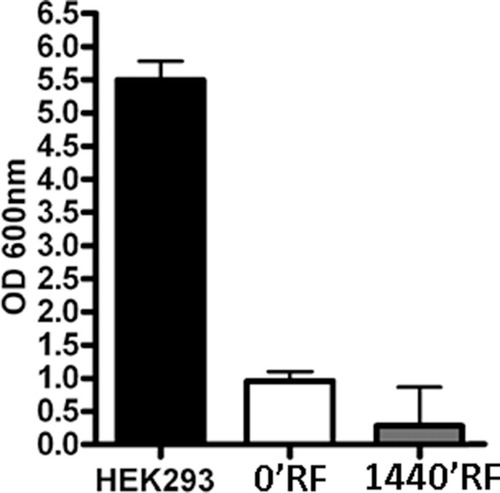
Figure 5 Effects on anchorage-independent growth of Mesenchymal Stem Cells (MSCs) after Radiofrequency (RF) exposure. Graphical representation of optical density readings at OD 600 nm derived from methanol elution of the crystal violet stain for each condition (n=3, ± SD).