Figures & data
Table 1 The Characteristics of the Study Group
Figure 1 Mesenchymal stem cells from a 4-day culture bright field microscopy (BF), 200× magnification, using Xcellence RT system with an IX81 inverted microscope (Olympus).
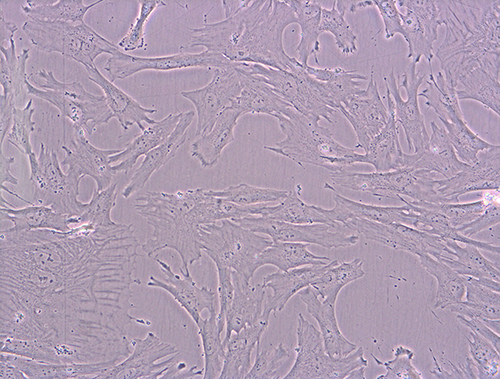
Figure 2 Cytometric evaluation of the presence of CD146, CD195, CD90, CD73 surface antigens on the analyzed MSCs. Navios Cytometer (Beckman Coulter).
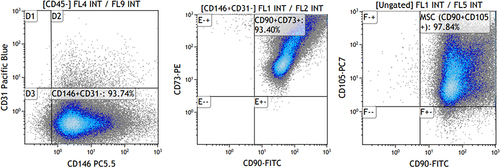
Figure 3 Cytometric evaluation of cell viability using propidium iodide and annexin V. Navios cytometer (Beckman Coulter).
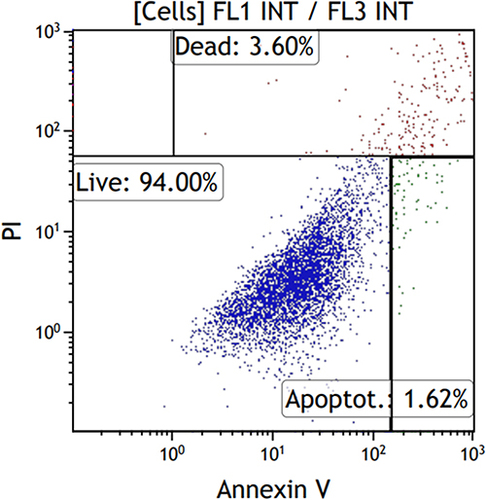
Figure 4 Cytometric evaluation of cell proliferation using Ki67 in analyzed MSCs. Navios Cytometer (Beckman Coulter).
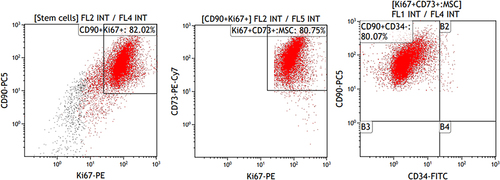
Figure 5 Cytometric evaluation of the cell cycle phases of the analyzed MSCs. Navios Cytometer (Beckman Coulter).
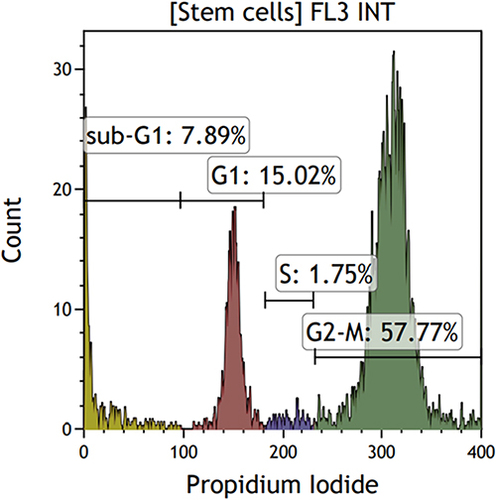
Table 2 Relationships Between the Expression of the Studied Genes in MSC and the Age of the Mother, the Number of Pregnancies and Deliveries, the Gestation Week in Which the Delivery Oc-Curred and the Body Weight of the Newborn
Figure 6 Graph of distribution newborn weight and VEGFA gene expression. *p < 0.05 Spearman correlations.
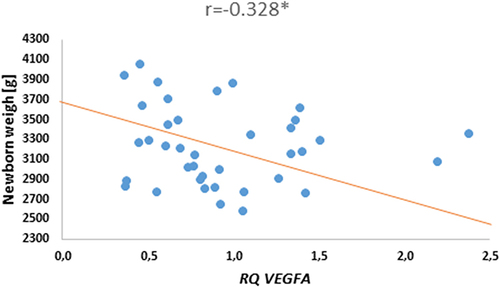
Figure 7 Mean (RQ±SE) expression VEGFB gene in MSC, depending on the time of childbirth, *p < 0.05 U Mann Whitney Test.
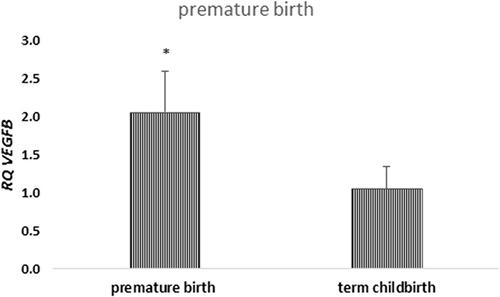
Figure 8 Graph of distribution HBD and VEGFB gene expression. *p < 0.05 Spearman correlations.
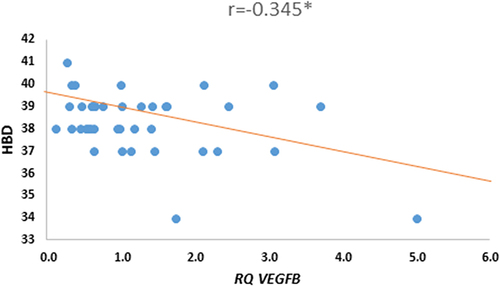
Figure 9 Mean (RQ±SE) expression of VEGFA and VEGFC genes in MSC, depending on the prevalence of hypertension in pregnant women, *p < 0.05 U Mann Whitney Test.
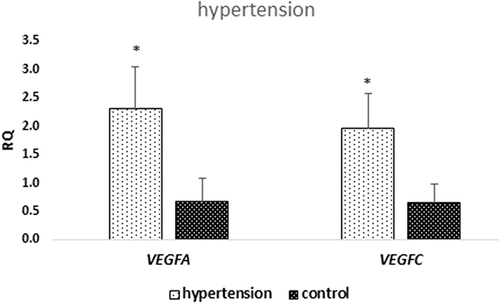
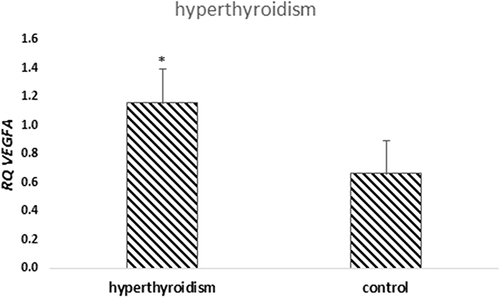
Figure 10 Mean (RQ±SE) expression VEGFA gene in MSC, depending on prevalence of hyperthyroidism, *p < 0.05 U Mann Whitney Test.