Figures & data
Figure 1 Morphology characteristics of mouse MSCs cultured in MEM +20% FBS after 24 hours as revealed under inverted microscope.
Abbreviations: MSCs, mesenchymal stem cells; MEM, minimum essential medium; FBS, fetal bovine serum.
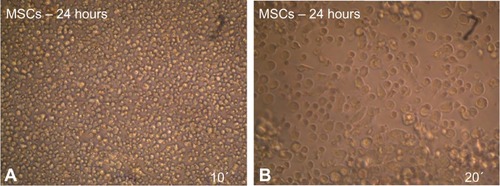
Figure 2 After 72 hours of culturing mouse MSCs in MEM +20% FBS, note that some of the cells became adherent and began to elongate as revealed under inverted microscope.
Abbreviations: MSCs, mesenchymal stem cells; MEM, minimum essential medium; FBS, fetal bovine serum.
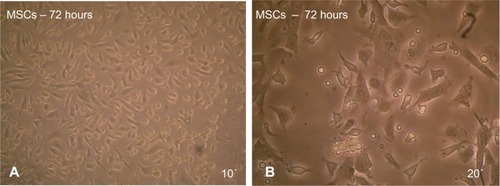
Figure 3 Maintenance of MSCs in culture.
Abbreviation: MSCs, mesenchymal stem cells.
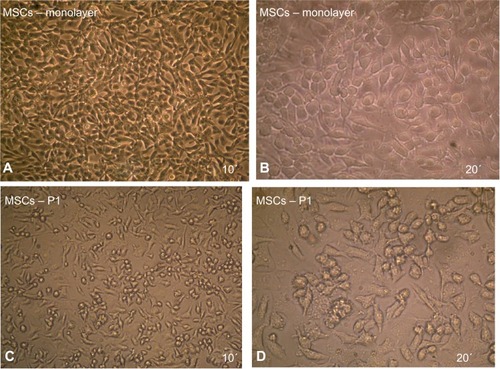
Figure 4 Immunophenotypic analysis of MSCs at the first passage revealed under light microscope show that the MSCs were negative by cell stained with blue color.
Abbreviation: MSCs, mesenchymal stem cells.
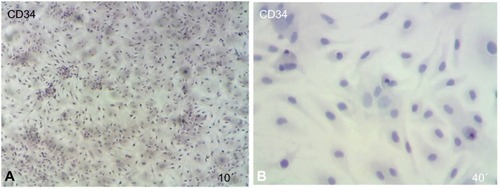
Figure 5 Immunophenotypic analysis of MSCs at the first passage revealed under light microscope show that the MSCs were positive cells stained with brown color.
Abbreviation: MSCs, mesenchymal stem cells.
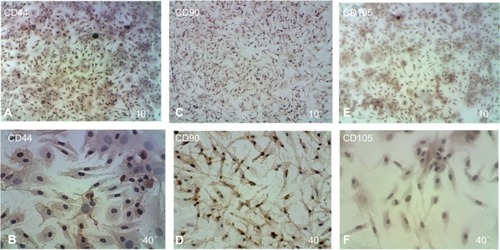
Figure 6 MSCs after induced differentiation by BME, which showed the spherical shape of cells and their branched form toward the neural cells as revealed under inverted microscope.
Abbreviations: MSCs, mesenchymal stem cells; BME, β-mercaptoethanol.
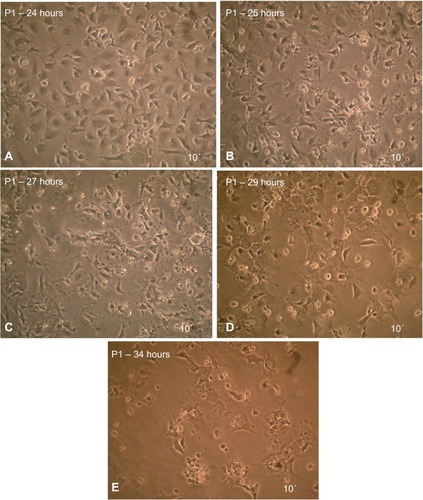
Figure 7 ICC detection results of MSCs after induced differentiation by BME, which showed the increase of NES and NF-L protein through the different exposure times, compared with no increase of MAP-2 protein as revealed under light microscope.
Abbreviations: ICC, immunocytochemistry; MSCs, mesenchymal stem cells; BME, β-mercaptoethanol; NES, nestin, NF-L, neurofilament light; MAP-2, microtubule-associated protein 2.
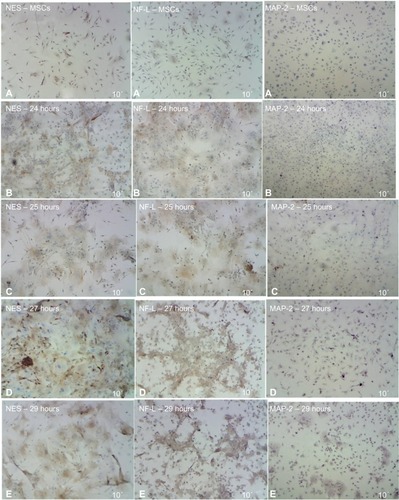
Figure 8 The protein expression levels of ICC assay for NES, NF-L, and MAP-2 antibodies of neural cells after being induced by BME.
Abbreviations: ICC, immunocytochemistry; NES, nestin; NF-L, neurofilament light; MAP-2, microtubule-associated protein 2; BME, β-mercaptoethanol; MSCs, mesenchymal stem cells; se, standard error.
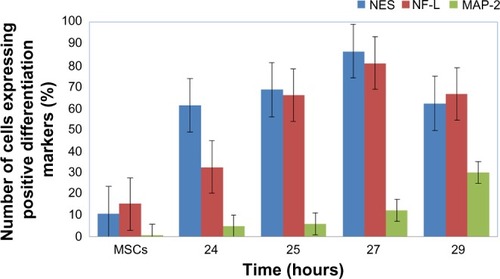
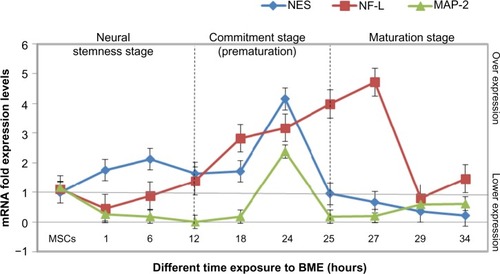
Figure 9 mRNA expression levels of the real time-PCR analysis of NES, NF-L, and MAP-2 genes in MSCs treated with BME.
Abbreviations: PCR, polymerase chain reaction; NES, nestin; NF-L, neurofilament light; MAP-2, microtubule-associated protein 2; MSCs, mesenchymal stem cells; BME, β-mercaptoethanol; SEM, standard error of mean.
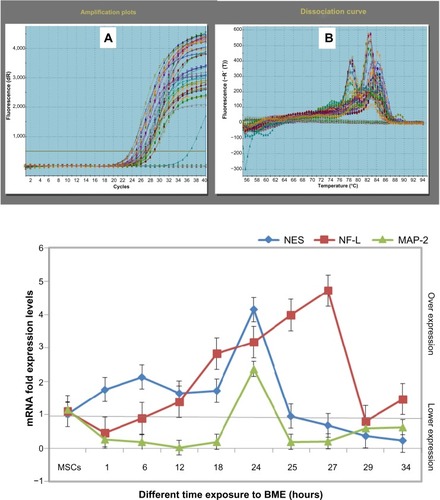
Figure 10 Neural stem cells induction by (A) 6 and (B) 24 hours exposure to BME as revealed under inverted microscope.
Abbreviations: BME, β-mercaptoethanol; MSCs, mesenchymal stem cells.
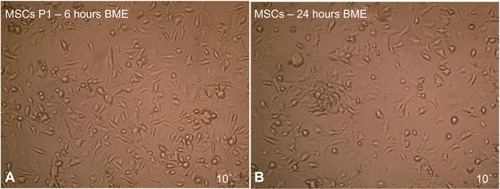
Figure 11 Neural stem cells induction after 24 hours exposure to BME using four different culturing media formula.
Abbreviations: BME, β-mercaptoethanol; NSCs, neural stem cells.
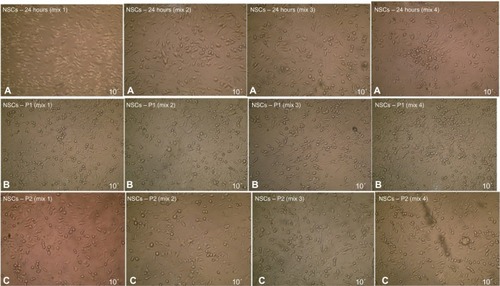
Figure 12 RT-PCR analysis of NES, NF-L, and MAP-2 genes in NSCs using BME, which indicated the stability of the NES gene in all the different culturing media formulas and the instability of each NF-L and MAP-2 genes compared with the 24 hours exposure (the production stage of NSCs).
Abbreviations: RT-PCR, real time-PCR; NES, nestin; NF-L, neurofilament light; MAP-2, microtubule-associated protein 2; NSCs, neural stem cells; BME, β-mercaptoethanol; SEM, standard error of mean; EGF, epidermal growth factor; FGF, fibroblast growth factor; MSCs, mesenchymal stem cells.
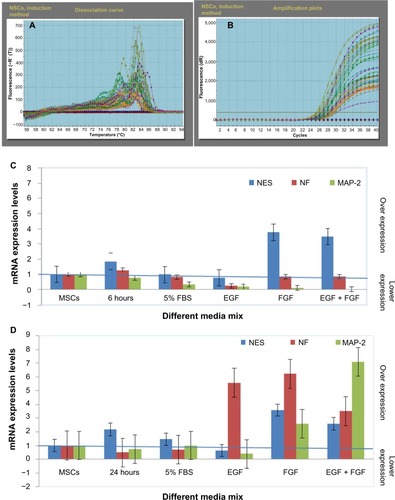
Figure 13 Showing the neurogenesis pathway that MSCs induced toward neurons, where we can indicate the neural stemness state by following gene expression of the neurogenesis markers (NES, NF-l, and MAP-2) after prove of stemness at 6 hours of exposure to BME.