Figures & data
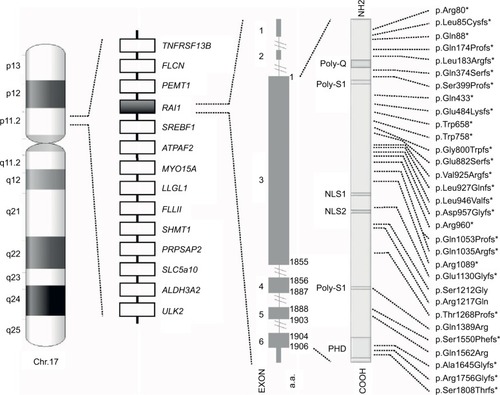
Figure 1 Schematic representation of chromosome 17, common 17p11.2 deletion, and RAI1. From left to right, the following are shown: the ideogram of G-band pattern of human chromosome 17; a schematic representation of the Smith–Magenis syndrome region with some representative genes; the RAI1 genomic and protein structure – glutamine-rich domain (Poly-Q), bipartite nuclear localization signals (NLS1 and NLS2), two serine-rich domains (Poly-S1 and Poly-S2), and C-terminal plant homeodomain (PHD); and the RAI1 mutations indexed in the HGMD™ Professional (version December 2015.4) known to date. *Indicates either frameshift or nonsense mutations.