
Figures & data
Table 1 Assessment of Hardy–Weinberg equilibrium for rs1801278 genotypes
Table 2 Mean fasting serum glucose, insulin, HOMA and lipid profile concentration in T2DM patients and the control group
Table 3 Comparison of rs1801278 (alleles and genotypes) in all the studied T2DM patients and healthy controls
Figure 1 Identification of IRS1 gene polymorphism (r.2963G>A) using PCR-RFLP method.
Abbreviations: PCR, polymerase chain reaction; RFLP, restriction fragment length polymorphism.
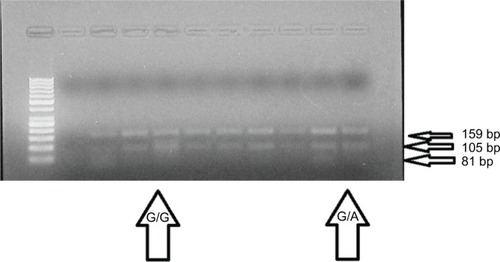
Table 4 Comparison of laboratory data according to IR
Table 5 Comparison of rs1801278 (genotypes and alleles) according to IS and IR in all the studied subjects
Table 6 Regression analysis for prediction of insulin resistance within T2DM cases
Table 7 Regression analysis for prediction of T2DM within healthy control subjects