
Figures & data
Figure 1 Transmission Electron Microscopy (TEM) images of feline CNS tissue. Normal axon in cross-section surrounded by thick myelin sheath (A). Multiple axons in cross-section of GM1 white matter, surrounded by disjointed and unravelling myelin layers (B). Normal oligodendrocyte with round nuclear envelope and prominent cytocavitary network (C). GM1 oligodendrocyte with multiple swollen mitochondria (black arrows) and irregularly-shaped nuclear envelope (white arrow) (D). Scale bars are 1μm. Transmission electron micrographs in panels A, B, and D, reproduced with permission Gray-Edwards HL, Maguire AS, Salibi N, et al. 7T MRI predictsamelioration of neurodegeneration in the brain after AAV genetherapy. Mol Ther - Methods Clin Dev. 2020;17:258–270.Citation146 © 2019 Elsevier.
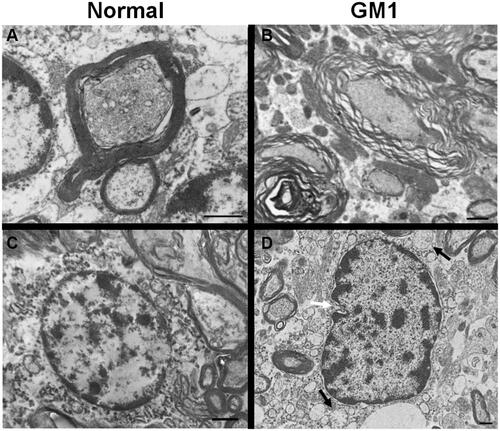
Table 1 Summary of GM1 Biomarkers Identified in the Serum, CSF, and by Brain MRS of Animal Models and Human Patients
Figure 2 An example of data collected from Magnetic Resonance Spectroscopy (MRS) and MRI of normal and GM1 cats. Cerebellar voxel defined in the cat for measurement of 1H MRS (open white square) (A). Example 1H spectrum with metabolites labeled and data output for the respective metabolites (B). Transverse T2w images of the cerebral cortex and cerebellum in normal and GM1 cats at 2 and 8 months of age. The isointensity of gray and white matter is prominent at 8 months for both the cerebral cortex and cerebellum of GM1 cats compared to normal controls. In GM1 cats, atrophy is mild and unilateral ventriculomegaly is apparent in the provided example (also occurs in normal controls) (C).
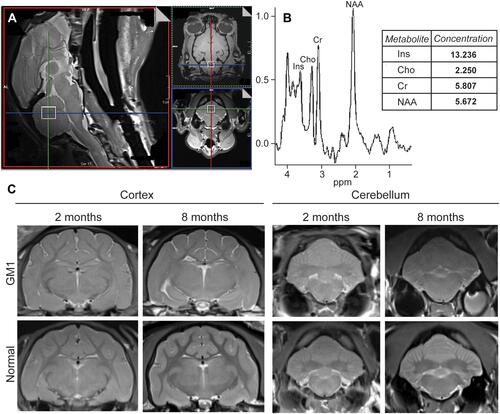
Figure 3 Management of GM1 Gangliosidosis. Clockwise, beginning on the left: Pharmacological chaperones for enzyme enhancement and small molecules for substrate reduction therapy (1–7), stem cell transplantation, gene therapy, and enzyme replacement (RCSB PDB ID: 3THC).Citation12
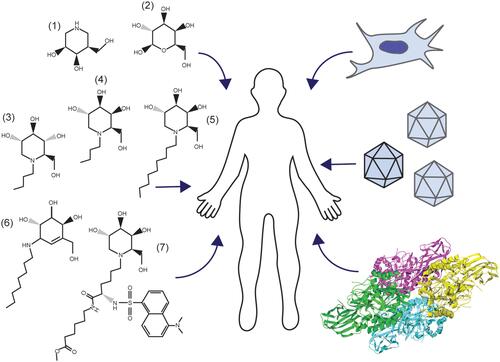
Table 2 Pharmacological Chaperone Influence on Mutant β-Gal Activity