
Figures & data
Figure 1 (A) Electrophoresis result from PCR-RFLP of HLA-DQA1 with Rsa1 restriction enzyme in T1DM groups. (B) Electrophoresis result from PCR-RFLP of HLA-DQA1 with Rsa1 restriction enzyme in control groups.
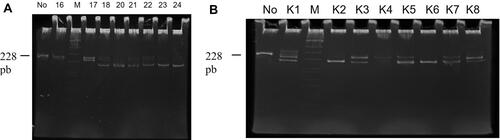
Table 1 Baseline Characteristics of the Subjects in This Study
Table 2 Distribution of HLA-DQA1 Polymorphisms in the T1DM and Control Groups
Table 3 Distribution HLA-DQB1 Polymorphisms in the T1DM and Control Groups