
Figures & data
Table 1 Comparison Between the Three Studied Groups According to Demographic and Laboratory Parameters
Figure 1 Comparison between groups regarding lncRNA ASB16-AS1 and lncRNA AFAP1-AS1 expression levels and ROC curves for their diagnostic performance. (A) Comparison between early-stage CRC patients and benign group according to lncRNA ASB16-AS1 and lncRNA AFAP1-AS1 expression levels. *Significant between early CRC and Group II. (B) Comparison between early-stage CRC patients and controls according to the lncRNA ASB16-AS1 and lncRNA AFAP1-AS1 expression levels. *Significant between early CRC and Group III. (C) ROC curve for lncRNA ASB16-AS1, lncRNA AFAP1-AS1, CEA, and CA19-9 to discriminate CRC group from benign group. (D) ROC curve for lncRNA ASB16-AS1 and lncRNA AFAP1-AS1 to distinguish CRC group from the control group. (E) ROC curve for lncRNA ASB16-AS1 and lncRNA AFAP1-AS1to discriminate early stages CRC patients from benign group. (F) ROC curve lncRNA ASB16-AS1 and lncRNA AFAP1-AS1to discriminate early stages CRC patients and controls.
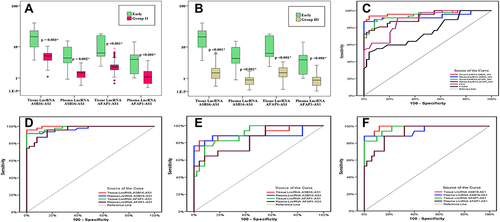
Table 2 Distribution of the Studied CRC Cases According to Pathological Finding, Staging and Survival (n = 47)
Table 3 Validity (AUC, Sensitivity, Specificity) of the lncRNAs to Discriminate Between Different Groups
Table 4 Relation Between Studied Markers with Different Parameters in CRC Patients (n = 47)
Figure 2 Correlation between studied lnRNA and CEA & CA19-9. (A) Correlation between tissue lncRNA ASB16-AS1 with CEA in CRC group. (B) Correlation between plasma lncRNA ASB16-AS1 with CEA in CRC group. (C) Correlation between tissue lncRNA ASB16-AS1 with CA19-9 in CRC group. (D) Correlation between plasma lncRNA ASB16-AS1 with CA19-9 in CRC group. (E) Correlation between tissue lncRNA AFAP1-AS1 with CA19-9 in CRC group.
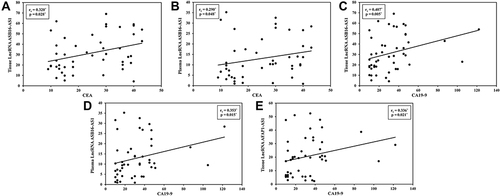
Figure 3 Kaplan-Meier survival curve for overall survival and progression-free survival with studied lncRNA. (A) Kaplan-Meier survival curve for overall survival with tissue lncRNA ASB16-AS1. (B) Kaplan-Meier survival curve for overall survival with plasma lncRNA ASB16-AS1. (C) Kaplan-Meier survival curve for overall survival with tissue lncRNA AFAP1-AS1. (D) Kaplan-Meier survival curve for overall survival with plasma lncRNA AFAP1- AS1. (E) Kaplan-Meier survival curve for progression-free survival with tissue lncRNA ASB16-AS1. (F) Kaplan-Meier survival curve for progression-free survival with plasma lncRNA ASB16-AS1. (G) Kaplan-Meier survival curve for progression-free survival with tissue lncRNA AFAP1-AS1. (H) Kaplan-Meier survival curve for progression-free survival with plasma lncRNA AFAP1-AS1.
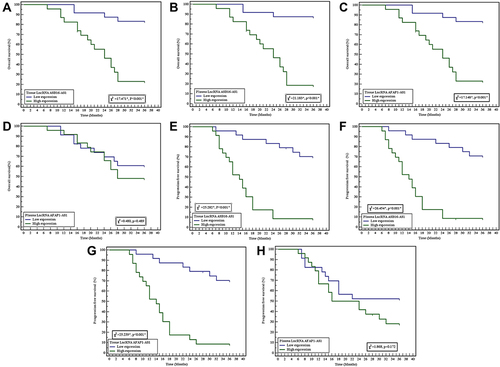
Table 5 Univariate and Multivariate Cox Regression Analysis for the Parameters Affecting Patients’ Survival