431
Views
0
CrossRef citations to date
0
Altmetric
ORIGINAL RESEARCH

The Unique Spectrum of MUTYH Germline Mutations in Colombian Patients with Extracolonic Carcinomas

, , ORCID Icon, ORCID Icon, ORCID Icon, & show all
Pages 53-62 | Received 12 Apr 2022, Accepted 10 Mar 2023, Published online: 18 Apr 2023

Figures & data

Table 1 Demographics, Clinical Presentation and Associated Variants

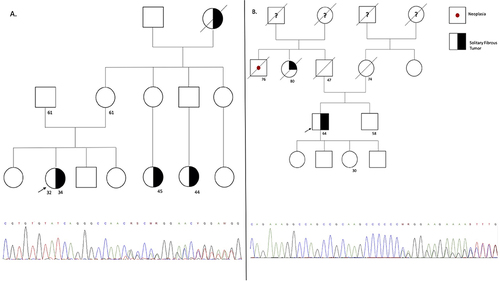
Figure 1 The figure represents the pedigree of each participant, which is correlate in . The symbols for each neoplasia type are stated (A) on the right side for (AD). The arrow represents the proband, the line crossing the symbol represents the dead status, the unique number represent current age, and symbols with two numbers represent the current age and age of diagnosis. On the bottom of the figure the sanger sequencing showing the variant encoding the MUTYH gene for all the families is stated.

Figure 1 The figure represents the pedigree of each participant, which is correlate in Table 1. The symbols for each neoplasia type are stated (A) on the right side for (A–D). The arrow represents the proband, the line crossing the symbol represents the dead status, the unique number represent current age, and symbols with two numbers represent the current age and age of diagnosis. On the bottom of the figure the sanger sequencing showing the variant encoding the MUTYH gene for all the families is stated.

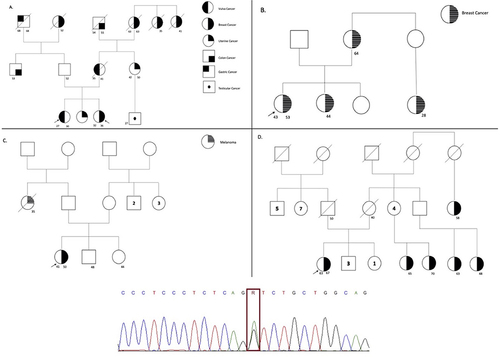
Figure 2 The figure represents the pedigree of each participant, which is correlate in . The symbols for each neoplasia type are stated (A and B) on the right side. The arrow represents the proband, the line crossing the symbol represents the dead status, the unique number represent current age, and symbols with two numbers represent the current age and age of diagnosis. On the bottom of the figure the sanger sequencing showing the variant encoding the MUTYH gene for all the families is stated.

Figure 2 The figure represents the pedigree of each participant, which is correlate in Table 1. The symbols for each neoplasia type are stated (A and B) on the right side. The arrow represents the proband, the line crossing the symbol represents the dead status, the unique number represent current age, and symbols with two numbers represent the current age and age of diagnosis. On the bottom of the figure the sanger sequencing showing the variant encoding the MUTYH gene for all the families is stated.

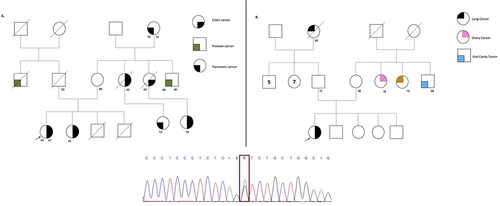
Figure 3 The figure represents the pedigree of each participant, which is correlate in . The symbols for each neoplasia type are stated (B) on the right side for (A and B). The arrow represents the proband, the line crossing the symbol represents the dead status, the unique number represent current age, and symbols with two numbers represent the current age and age of diagnosis. On the bottom of the figure the sanger sequencing showing the variant encoding the MUTYH gene for all the families is stated.

Figure 3 The figure represents the pedigree of each participant, which is correlate in Table 1. The symbols for each neoplasia type are stated (B) on the right side for (A and B). The arrow represents the proband, the line crossing the symbol represents the dead status, the unique number represent current age, and symbols with two numbers represent the current age and age of diagnosis. On the bottom of the figure the sanger sequencing showing the variant encoding the MUTYH gene for all the families is stated.

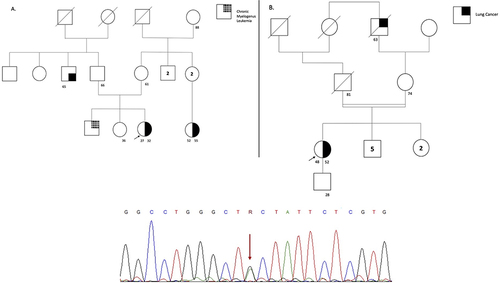
Figure 4 The figure represents the pedigree of each participant, which is correlate in . The symbols for each neoplasia type are stated (B) on the right side for (A and B). The arrow represents the proband, the line crossing the symbol represents the dead status, the unique number represent current age, and symbols with two numbers represent the current age and age of diagnosis. On the bottom of the figure the sanger sequencing showing the variant encoding the MUTYH gene for all the families is stated.

Figure 4 The figure represents the pedigree of each participant, which is correlate in Table 1. The symbols for each neoplasia type are stated (B) on the right side for (A and B). The arrow represents the proband, the line crossing the symbol represents the dead status, the unique number represent current age, and symbols with two numbers represent the current age and age of diagnosis. On the bottom of the figure the sanger sequencing showing the variant encoding the MUTYH gene for all the families is stated.