Figures & data
Table 3 Logistic regression model of genetic and clinical correlates of exercise responders (n = 34) and nonresponders (n = 8) to the immediate antihypertensive effects of aerobic exerciseTable Footnotea
Table 5 Logistic regression model of genetic and clinical correlates of MODERATE responders (n = 31) and ronresponders (n = 13) to the immediate antihypertensive effects of aerobic exerciseTable Footnotea
Table 1 Mean (± SEM) fasting clinical characteristics of the total sample and among exercise responders and nonrespondersTable Footnotea
Figure 1 The average adjusted systolic blood pressure change from baseline after LIGHT and MODERATE compared to nonexercise control at hourly intervals over 9 hr among exercise respondersa.
Abbreviations: LIGHT, 40% VO2 peak; MODERATE, 60% VO2 peak.
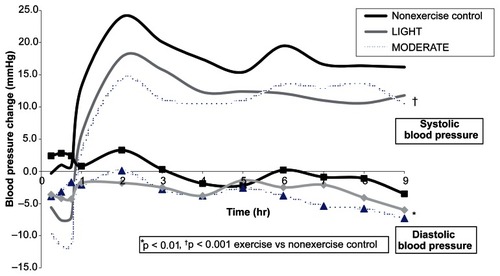
Figure 2 The average adjusted diastolic blood pressure change from baseline after LIGHT and MODERATE compared to nonexercise control at hourly intervals over 9 hr among exercise nonrespondersa.
Abbreviations: LIGHT, 40% VO2 peak; MODERATE, 60% VO2 peak.
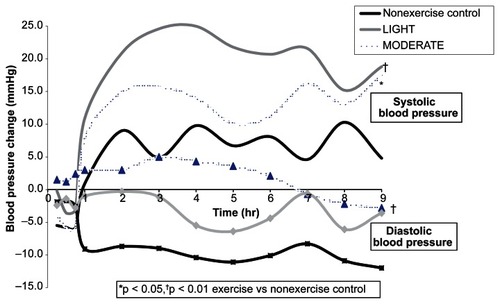
Table 2 Blood pressure difference {mean ± SEM (95% confidence interval)} from baseline after exercise versus nonexercise control over 9 hr among EXERCISE, LIGHT, and MODERATE responders and nonrespondersTable Footnotea
Table 4 Logistic regression model of genetic and clinical correlates of LIGHT responders (n = 30) and nonresponders (n = 13) to the immediate antihypertensive effects of aerobic exerciseTable Footnotea