Figures & data
Table 1 Demography of study population (n=142)
Table 2 Levels of confidence in different areas of antibiotic prescribing (n=142)
Table 3 Comparison among Year III, IV, and V in levels of confidence of antibiotic prescribing
Table 4 Comparison between sexes in levels of confidence of antibiotic prescribing
Figure 1 Questions on training in antibiotic prescribing.
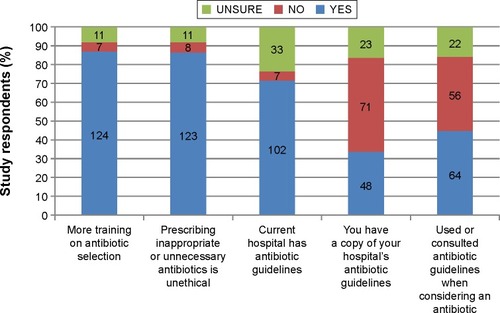
Figure 2 Students’ perceptions of antimicrobial resistance.
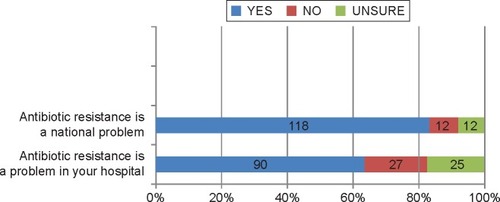
Figure 3 Knowledge of students that may shape perceptions of antimicrobial resistance.
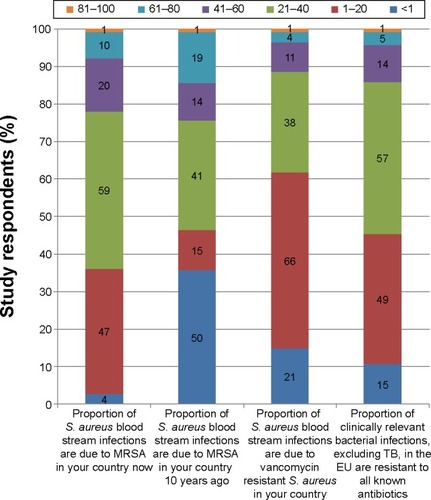
Figure 4 Knowledge of proportion of all clinical antibiotic usage.
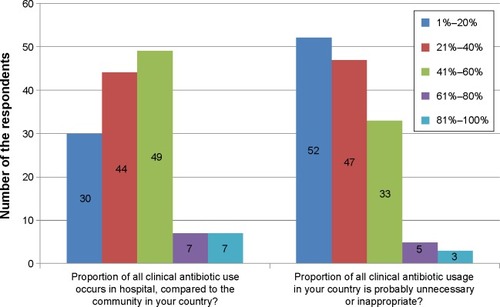
Table 5 Perceptions of the importance of potential contributors to antibiotic resistance (n=142)
Table 6 Comparison among Year III, IV, and V in levels of contributors to resistance
Table 7 Comparison between sexes on their view regarding contributors to resistance
Figure 5 New classes of antibiotics that students think became clinically available at years 1980–2011 and 2011–2020.
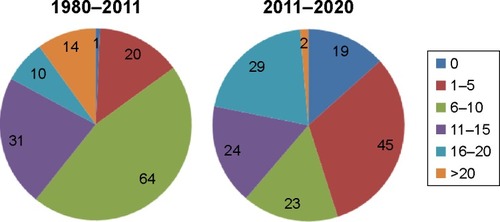
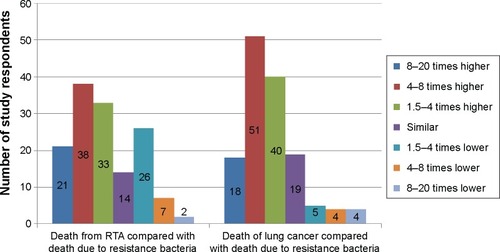
Figure 6 Student’s perception of death from road traffic accidents and lung cancer compared with death due to bacterial resistance to antimicrobials.