66
Views
22
CrossRef citations to date
0
Altmetric
Original Research

Association of glutathione S-transferase T1, M1, and P1 polymorphisms in the breast cancer risk: a meta-analysis

, , , , &
Pages 763-769 | Published online: 12 May 2016

Figures & data

Figure 1 Flowchart of study selection in this meta-analysis.

Abbreviation: HWE, Hardy–Weinberg equilibrium.
Figure 1 Flowchart of study selection in this meta-analysis.

Table 1 Characteristics of the literature included in the meta-analysis

Figure 2 Forest plot for the association of GSTM1 null polymorphism and breast cancer risk for Asians.

Abbreviations: GSTM1, glutathione S-transferase M1; OR, odds ratio; CI, confidence interval.
Figure 2 Forest plot for the association of GSTM1 null polymorphism and breast cancer risk for Asians.

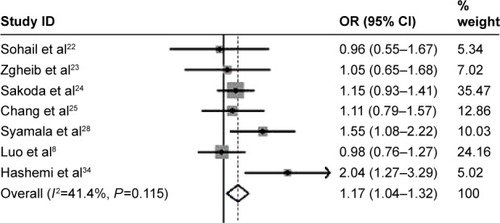
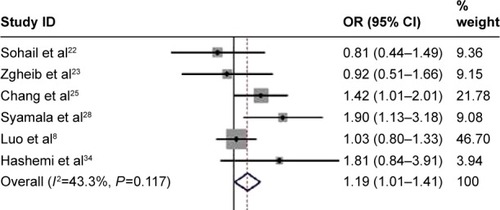
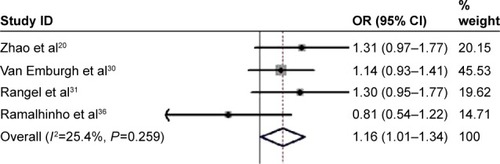
Table 2 Meta-analysis of the association between GSTM1, GSTT1, and GSTP1 polymorphisms and breast cancer risk

Figure 3 Forest plot for the association of GSTT1 null polymorphism and breast cancer risk for Caucasians.

Abbreviations: GSTT1, glutathione S-transferase T1; OR, odds ratio; CI, confidence interval.
Figure 3 Forest plot for the association of GSTT1 null polymorphism and breast cancer risk for Caucasians.

Figure 4 Forest plot for the association of GSTP1 Val105Ile (rs1695) polymorphism and breast cancer risk for Caucasians.

Abbreviations: GSTP1, glutathione S-transferase P1; OR, odds ratio; CI, confidence interval.
Figure 4 Forest plot for the association of GSTP1 Val105Ile (rs1695) polymorphism and breast cancer risk for Caucasians.