
Figures & data
Table 1 Baseline characteristics of the study patients (1:2 propensity score-matched sitagliptin and metformin cohorts)
Figure 1 Kaplan–Meier curves for cumulative hazard of a primary composite end point.
Note: Sitagliptin and metformin cohorts are propensity score-matched.
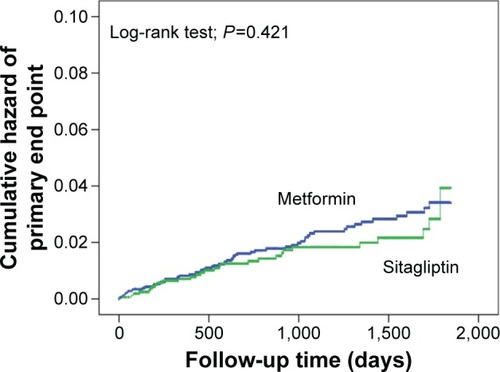
Figure 2 Kaplan–Meier curves for cumulative hazard of a secondary composite end point.
Note: Sitagliptin and metformin cohorts are propensity score-matched.
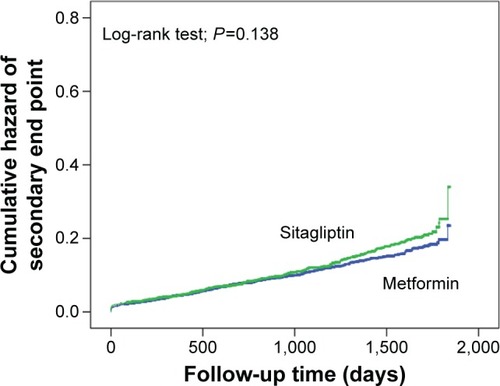
Table 2 Propensity score-matched analysis for incidence rates and relative risks of CVD complications associated with sitagliptin versus metformin
Table 3 Subgroup analyses for incidence rates and relative risks of CVD complications associated with sitagliptin versus metformin in patients with high CV risk factors
Table 4 Propensity score-matched analysis for safety end points