Figures & data
Table 1 Baseline patient data
Figure 1 Percent changes of 25(OH)D3 (A), whole PTH (B), and pentosidine (C) in the MIN and RIS groups.
Notes: Error bars indicate standard error. *Significant difference (P<0.05).
Abbreviations: PTH, parathyroid hormone; MIN, minodronate; RIS, risedronate.
Abbreviations: PTH, parathyroid hormone; MIN, minodronate; RIS, risedronate.
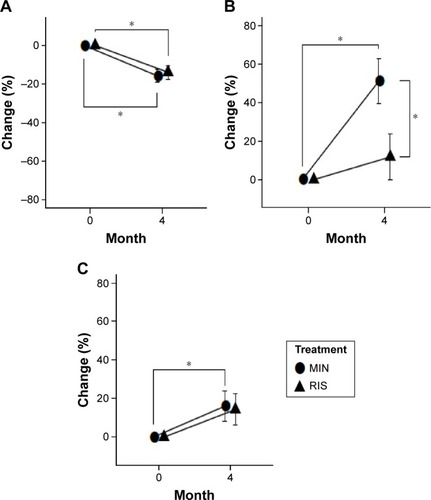
Table 2 Laboratory data for the MIN group before and after treatment
Table 3 Laboratory data for the RIS group before and after treatment
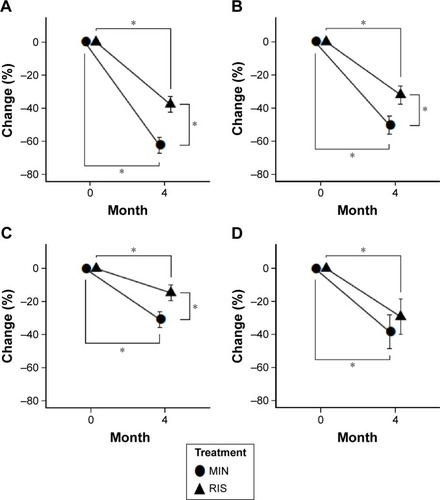
Figure 2 Percent changes of urinary NTX (A), TRACP-5b (B), BAP (C), and ucOC (D) in the MIN and RIS groups.
Notes: Error bars indicate standard error. *Significant difference (P<0.05).
Abbreviations: NTX, urinary cross-linked N-telopeptide of type I collagen; TRACP-5b, tartrate-resistant acid phosphatase; BAP, bone-specific alkaline phosphatase; ucOC, undercarboxylated osteocalcin; MIN, minodronate; RIS, risedronate.
Abbreviations: NTX, urinary cross-linked N-telopeptide of type I collagen; TRACP-5b, tartrate-resistant acid phosphatase; BAP, bone-specific alkaline phosphatase; ucOC, undercarboxylated osteocalcin; MIN, minodronate; RIS, risedronate.