Figures & data
Figure 1 Flowchart of the literature search.
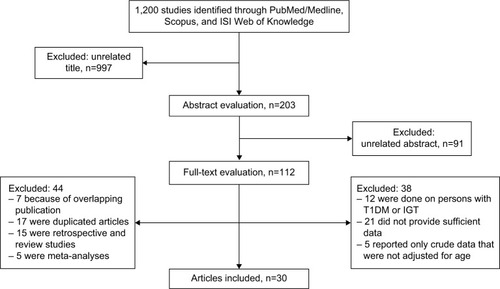
Table 1 The characteristics of the studies entered into the meta-analysis
Figure 2 The results of meta-analysis of the association between type 2 diabetes mellitus and risk of hip fracture.
Abbreviations: CI, confidence interval; ES, effect size.
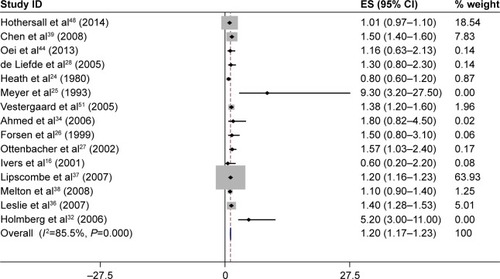
Table 2 Summary relative risk estimates from case–control and cohort studies of the association between type 2 diabetes mellitus and fractures incidence using meta-analysis methods
Figure 3 The results of meta-analysis of the association between type 2 diabetes mellitus and risk of wrist fracture.
Abbreviations: CI, confidence interval; ES, effect size.
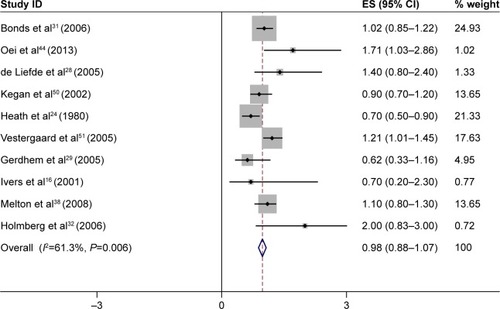
Figure 4 The results of meta-analysis of association between type 2 diabetes mellitus and risk of overall fractures.
Abbreviations: CI, confidence interval; ES, effect size.
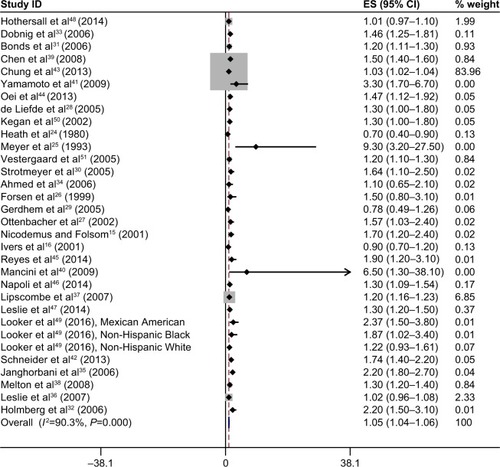
Table 3 Risk factors for the association between type 2 diabetes and fracture risk
Figure 5 Begg’s funnel plot for publication bias in the risk difference analysis.
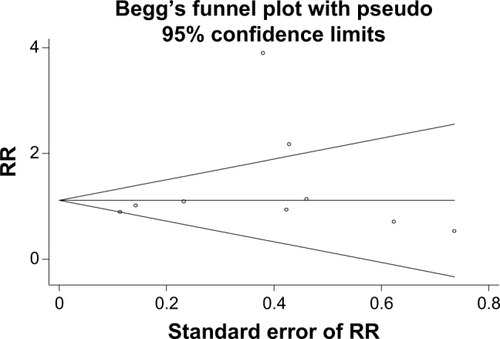
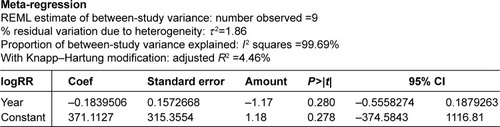
Figure 6 The meta-regression analysis of the relationship between the risk of factors in diabetic patients and the year of study.