
Figures & data
Table 1 Personal characteristics and baseline laboratory para meters of the study sample
Table 2 Correlation between initial serum levels of vitamin D3 and measured laboratory variables
Figure 1 Change in hemoglobin A1c (HbA1c) after vitamin D intake.
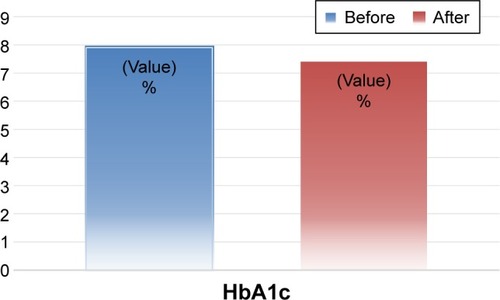
Table 3 Changes in different variables with vitamin D3 replacement
Figure 2 Change of serum creatinine after vitamin D intake.
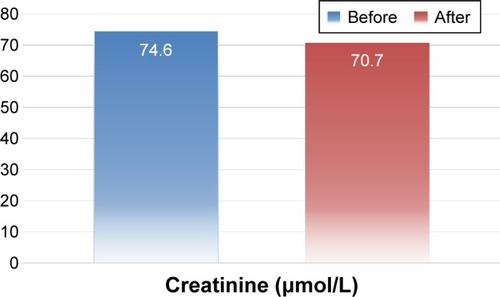
Figure 3 Change in hemoglobin A1c (HbA1c) in relation with its initial level before treatment.
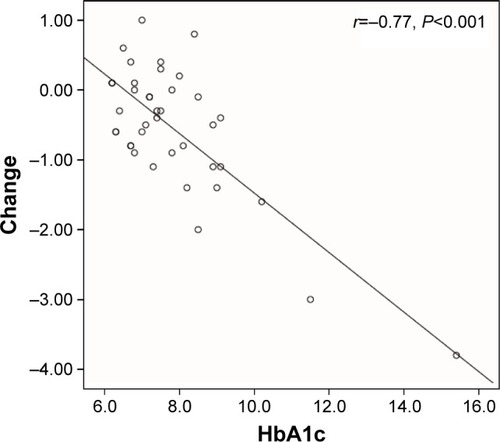
Table 4 Correlation coefficients between changes in laboratory variables with their initial levels before treatment
Table 5 Mean percent changes for different laboratory variables
Table 6 Mean changes for different laboratory variables
Table 8 The correlation coefficients between parathyroid hormone, alkaline phosphatase and phosphate levels with different laboratory variables
Table 7 Correlation between initial levels of vitamin D and changes in different laboratory variables