Figures & data
Figure 1 Flow diagram of study selection for meta-analysis.
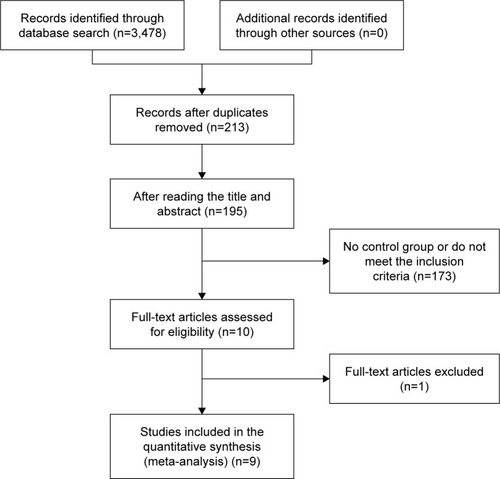
Table 1 Characteristics of patients in studies included in the meta-analysis
Table 2 Characteristics of the nine selected studies included in the meta-analysis
Figure 2 Funnel plot of blood loss outcome.
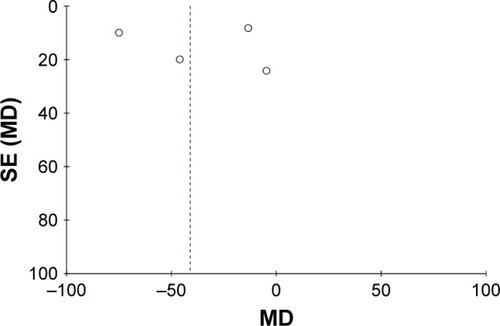
Figure 3 Forest plot of blood loss outcome.
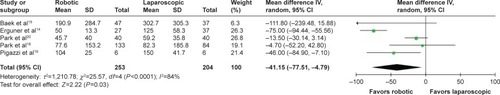
Figure 4 Funnel plot of involvement of circumferential resection margin outcome.
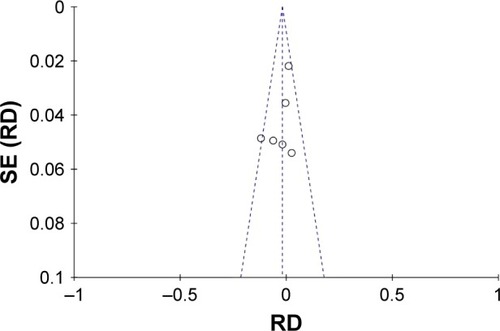
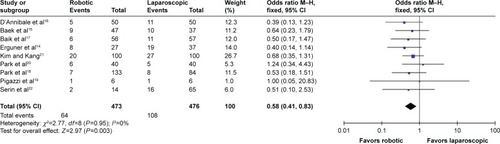
Figure 5 Forest plot of involvement of circumferential resection margin outcome.
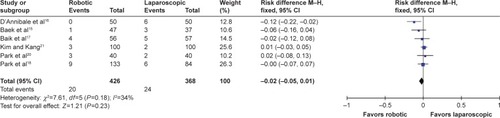
Figure 6 Funnel plot of conversion rate outcome.
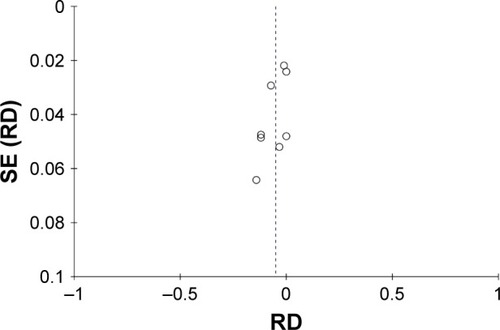
Figure 7 Forest plot of conversion rate outcome.
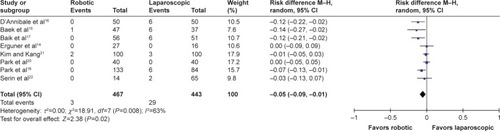
Figure 8 Forest plot of days to first passing flatus outcome.
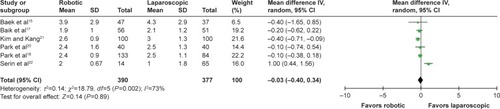
Figure 9 Forest plot of length of hospital stay outcome.
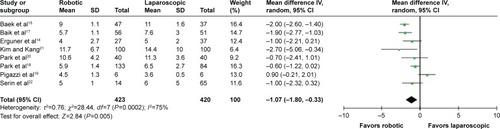
Figure 10 Forest plot of operative time outcome.
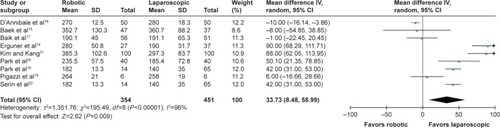
Figure 11 Forest plot of postoperative complications outcome.