
Figures & data
Table 1 Characteristics of patients prior to the study
Figure 1 Comparisons of percent changes in L-BMD and H-BMD between TRACP-5b (<420 mU/dL) and TRACP-5b (≥420 mU/dL) groups just prior to and during denosumab administration (A, B). Comparisons of percent changes in L-BMD and H-BMD in BAP (<14.5 µg/L)and BAP (≥14.5 µg/L) groups just prior to and during denosumab administration (C, D). *p<0.05; **p<0.01; #p<0.05; ##p<0.01. Results are expressed as mean ± standard error.
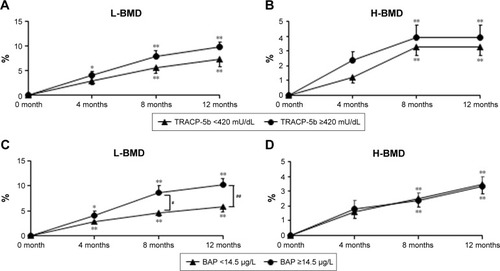
Table 3 Patient characteristics prior to the study after classification of BAP values, and L-BMD and H-BMD values at 0, 4, 8, and 12 months of denosumab treatment
Table 2 Patient characteristics prior to the study after classification of TRACP-5b values, and L-BMD and H-BMD values at 0, 4, 8, and 12 months of denosumab treatment