Figures & data
Table 1 The comparison of clinical data before treatment
Table 2 The comparison of general data before treatment
Figure 1 %fT>MIC in L group and Con group with MIC of 8 and 16 µg/mL.
Notes: The Con group (conventional treatment group) received traditional infusion of TZP and the L group (improved administration group) received it as prolonged infusion. %fT >MIC represents the percent time that free drug concentrations remain above the MIC.
Abbreviation: MIC, minimum inhibitory concentration.
Abbreviation: MIC, minimum inhibitory concentration.
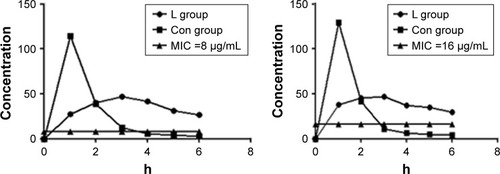
Figure 2 ROC curve of SOFA score, APACHE II and CPIS score. When the SOFA score was 9, the sensitivity was 84% and the specificity was 57%.
Abbreviations: APACHE II, acute physiology and chronic health evaluation II; CPIS, clinical pulmonary infection score; ROC, receiver operating characteristic; SOFA, Sequential Organ Failure Assessment.
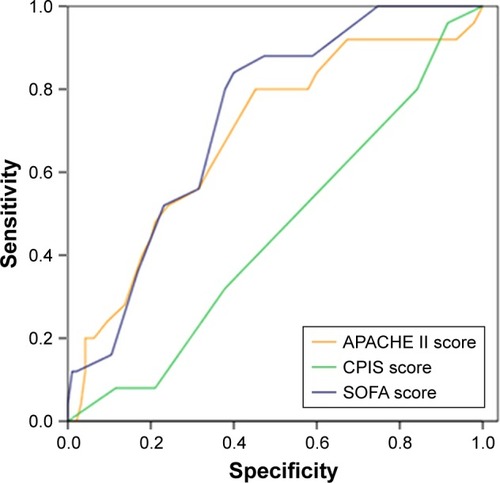
Figure 3 Survival curve of L group and Con group.
Note: The Con group (conventional treatment group) received traditional infusion of TZP and the L group (improved administration group) received it as prolonged infusion.
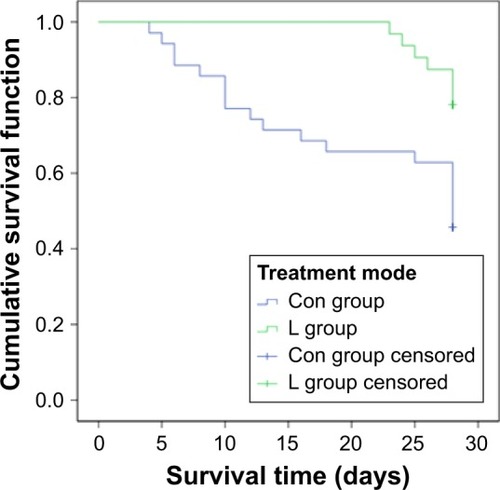
Table 3 The comparison of clinical data in each group after treatment
Figure 4 Survival curve of M1 and M2 groups.
Notes: There was no significant difference in the survival time between M1 and M2 groups. The Con group (conventional treatment group) received traditional infusion of TZP and the L group (improved administration group) received it as prolonged infusion. Blood drug concentration was detected at different time points. Based on the SOFA cut-off value of 9, the patients were regrouped into M (mild) and S (severe) groups. M1: mild group with prolonged administration; M2: mild group with traditional administration.
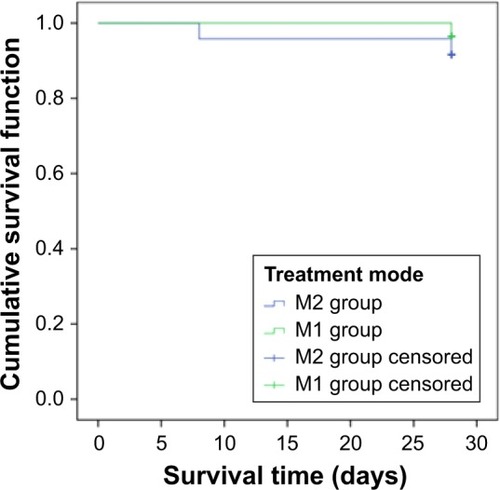
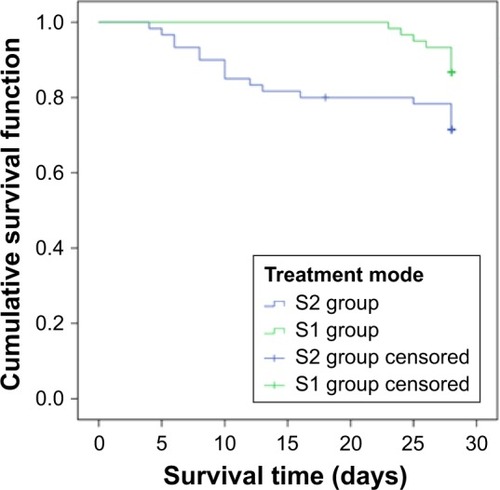
Figure 5 Survival curve of S1 and S2 groups.
Notes: The survival of S1 group was better than that of S2 group. The Con group (conventional treatment group) received traditional infusion of TZP and the L group (improved administration group) received it as prolonged infusion. Blood drug concentration was detected at different time points. Based on the SOFA cutoff value of 9, the patients were regrouped into M (mild) and S (severe) groups. S1: severe group with prolonged administration; S2: severe group with traditional administration.