
Figures & data
Figure 1 (A) Preoperative X-ray of a patient with Sanders Type 4 calcaneal fracture, (B and C) preoperative coronal and sagittal CT images of the same patient, (D) early postoperative X-ray of the patient.
Abbreviation: CT, computed tomography.
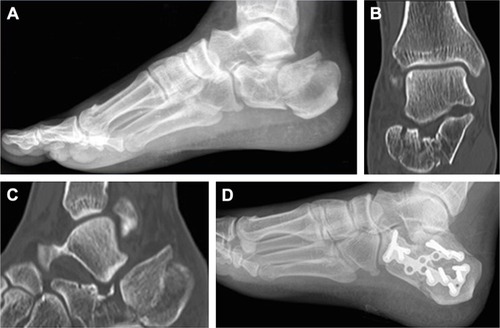
Table 1 Age distribution of the groups
Table 2 Gender distribution of the groups
Table 3 Distribution of side, Sanders type, and clinical results according to AOFAS between the groups
Table 4 Distribution of Bohler’s and Gissane’s angles, height, AOFAS score, and follow-up time between the groups