Figures & data
Figure 1 Reduction in uterine volume following administration of a GnRHSA and rebound following discontinuation of treatment.
Note: Reproduced with permission from Matta WHM, Shaw RW, Nye M. Long-term follow-up of patients with uterine fibroids after treatment with the LHRH agonist buserelin. Br J Obstet Gynaecol. Copyright © 2005, John Wiley and Sons.Citation37
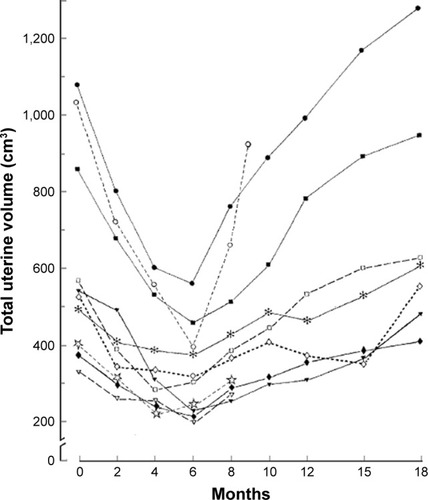
Figure 2 Hemoglobin levels during a 3-month pretreatment with a GnRHSA in three groups of patients with uterine myomas: G+I: GnRHSA plus Iron supplementation. G+P: GnRHSA+placebo. I: iron supplementation only.
Note: Reprinted from Fertility and Sterility, Vol 108(1), Benagiano G, Cronjé H, Kivinen ST, et al, Zoladex (goserelin acetate) and the anemic patient: results of a multicenter fibroid study, Pages 223–229, Copyright (1996), with permission from Elsevier.Citation46
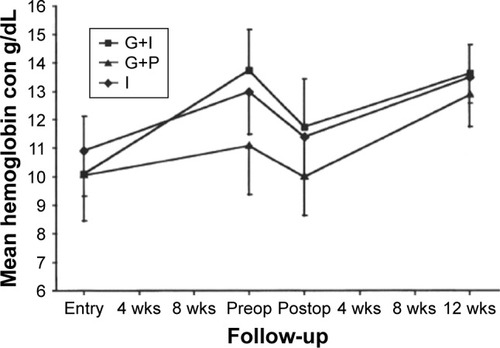
Figure 3 The hypothesis proposed by Barbieri in 1990.
Notes: It postulates the existence of three zones characterized by different levels of circulating estrogens following GnRHSA administration. Zone A, where high levels immediately follow administration of the analog. Zone C, where low levels are induced by the full action of the GnRHSA. Zone B, where some rebound exists following treatment with an add-back therapy. At these intermediate concentrations, only minimal regrowth occurs. Data from Barbieri et al, 1990.Citation65
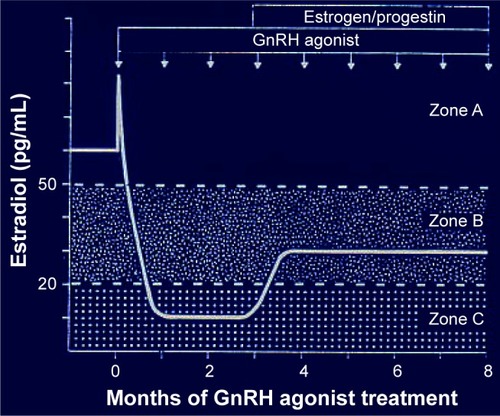
Figure 4 Effect of the administration of a GnRH antagonist on uterine size.
Notes: ***p<0.0001. Reprinted from Fertility and Sterility, Vol 108(1), Kettel LM, Murphy AA, Morales AJ, Rivier J, Vale W, Yen SS, Rapid regression of uterine leiomyomas in response to daily administration of gonadotropin-releasing hormone antagonist, Pages 642–646, Copyright (1993), with permission from Elsevier.Citation71
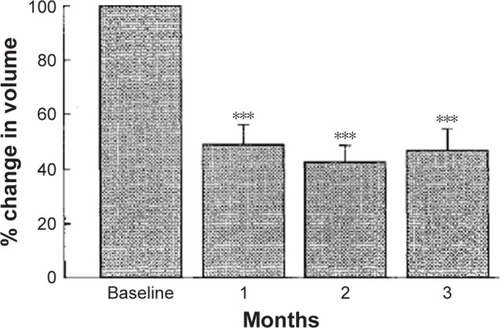
Figure 5 Mean percentage change in menstrual blood loss during the last 28 days of treatment.
Notes: **P≤0.01; ***P≤0.001. P-values are for difference in LS mean change from baseline vs PBO. Reprinted from Fertility and Sterility, Vol 108(1), Archer DF, Stewart EA, Jain RI, et al, Elagolix for the management of heavy menstrual bleeding associated with uterine fibroids: results from a phase 2a proof-of-concept study, Pages 152–160, Copyright (2017), with permission from Elsevier.Citation96
Abbreviations: BID, twice daily; CEP, E2 1 mg continuously and cyclical oral P 200 mg; E, elagolix (doses in mg); E2/NETA, E2 0.5 mg and norethisterone acetate 0.1 mg continuously; LS, least squares; PBO, placebo; QD, once daily; SE, standard error.
Abbreviations: BID, twice daily; CEP, E2 1 mg continuously and cyclical oral P 200 mg; E, elagolix (doses in mg); E2/NETA, E2 0.5 mg and norethisterone acetate 0.1 mg continuously; LS, least squares; PBO, placebo; QD, once daily; SE, standard error.
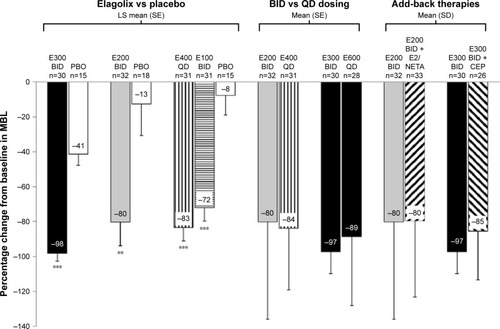
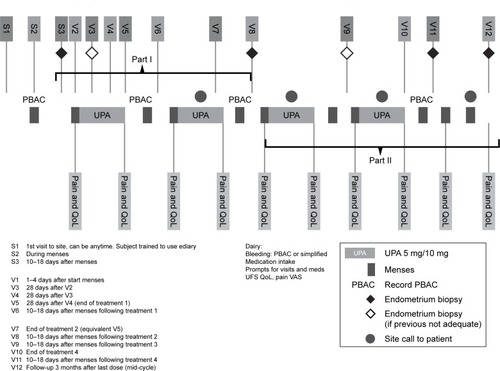
Figure 6 Administration schedule for ulipristal in the treatment of uterine myomas.
Note: Reprinted from Fertility and Sterility, Vol 105(1), Donnez J, Donnez O, Matule D, et al, Long-term medical management of uterine fibroids with ulipristal acetate, Pages 165–173, Copyright (2016), with permission from Elsevier.Citation164
Abbreviations: PA, ulipristal acetate; PBAC, pictorial blood assessment chart.
Abbreviations: PA, ulipristal acetate; PBAC, pictorial blood assessment chart.