Figures & data
Figure 1 Selection of studies for inclusion in meta-analysis.
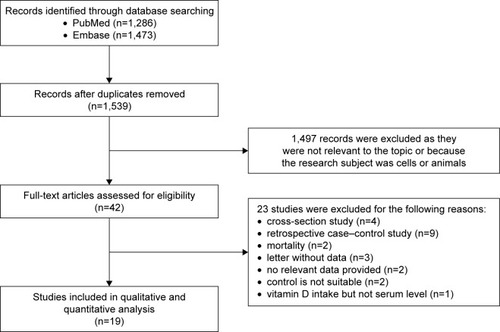
Table 1 Characteristics of included studies on the association between circulating vitamin D concentrations and prostate cancer
Figure 2 Higher 25[OH]D concentration was significantly correlated with elevated risk of prostate cancer.
Note: Weights are from random effects analysis.
Abbreviations: 25[OH]D, 25-hydroxyvitamin D; CI, confidence interval; RR, relative risk.
Abbreviations: 25[OH]D, 25-hydroxyvitamin D; CI, confidence interval; RR, relative risk.
![Figure 2 Higher 25[OH]D concentration was significantly correlated with elevated risk of prostate cancer.](/cms/asset/0c1c5781-d9e3-4d93-90b1-9f6a7b2d977a/dtcr_a_149325_f0002_c.jpg)
Table 2 The results of subgroup analysis between 25[OH]D concentration and risk of prostate cancer
Figure 3 Nonlinear dose–response relationship between 25[OH]D concentration and risk of prostate cancer.
Abbreviations: 25[OH]D, 25-hydroxyvitamin D; RR, relative risk.
![Figure 3 Nonlinear dose–response relationship between 25[OH]D concentration and risk of prostate cancer.](/cms/asset/8af8512b-cafd-4959-93f3-c6477b4ce363/dtcr_a_149325_f0003_b.jpg)
Figure 4 Linear dose–response relationship between circulating 25[OH]D concentration and prostate cancer.
Note: Weights are from random effects analysis.
Abbreviations: 25[OH]D, 25-hydroxyvitamin D; CI, confidence interval; RR, relative risk.
Abbreviations: 25[OH]D, 25-hydroxyvitamin D; CI, confidence interval; RR, relative risk.
![Figure 4 Linear dose–response relationship between circulating 25[OH]D concentration and prostate cancer.](/cms/asset/2c1fcfbb-a381-4cb9-9f3c-46677134e9b3/dtcr_a_149325_f0004_c.jpg)
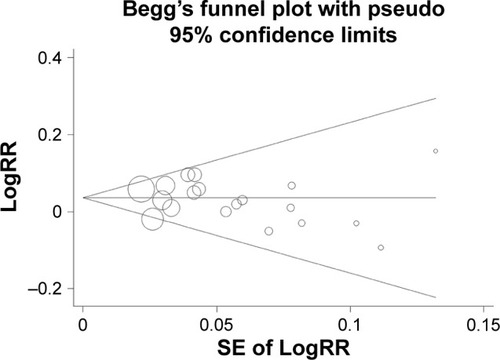
Figure 5 The funnel plot in the dose–response meta-analysis did not detect publication bias.
Abbreviations: RR, relative risk; SE, standard error.