
Figures & data
Figure 1 Flow chart of study participants.
Abbreviations: BDI, Beckman depression inventory; CHD, coronary heart disease; KoGES, Korean Genome Epidemiology Study.
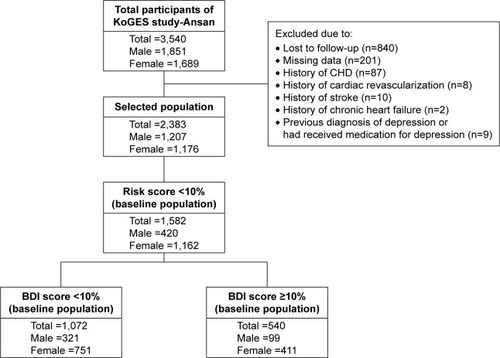
Table 1 Characteristics of the study population
Figure 2 Change of CHD risk scores between baseline and 8-year follow-up in men and women.
Notes: A horizontal line indicates the Framingham CHD risk score with 10. ([img], low-risk group; [img], intermediate or high-risk group).
Abbreviation: CHD, coronary heart disease.
Abbreviation: CHD, coronary heart disease.
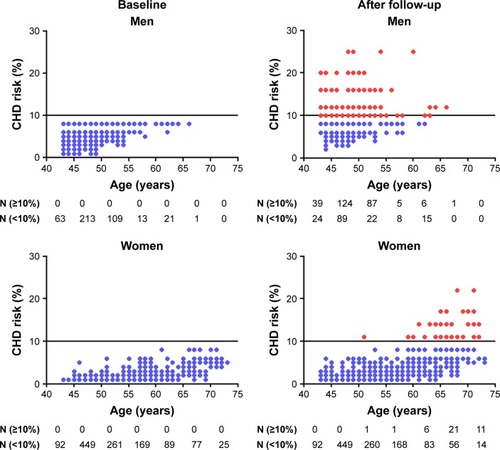
Table 2 Logistic regression analysis of the association between depression and change of CHD risk score status