
Figures & data
Table 1 OHIR score model for predicting prolonged ICU stay
Table 2 Demographic and clinical data
Table 3 Number of patients and mean ICU stay for each OHIR score
Figure 1 AUC for ROC of the OHIR score to discriminate a prolonged ICU stay.
Abbreviations: OHIR, Open-Heart Intraoperative Risk; A, area; AUC for ROC, area under the receiver operating characteristic curve; ICU, intensive care unit.
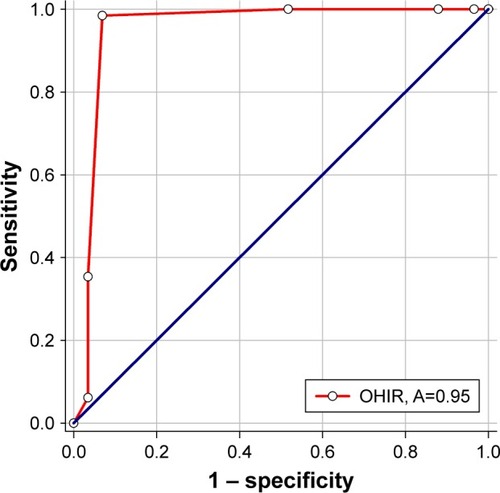
Figure 2 Cutoff point for the OHIR score.
Abbreviation: OHIR, Open-Heart Intraoperative Risk.
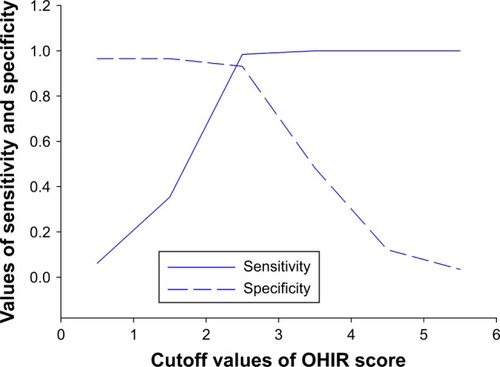
Table 4 Sensitivity, specificity, positive predictive value, negative predictive value, and AUC for ROC of the OHIR score ≥3