
Figures & data
Figure 1 Flowchart of patient selection.
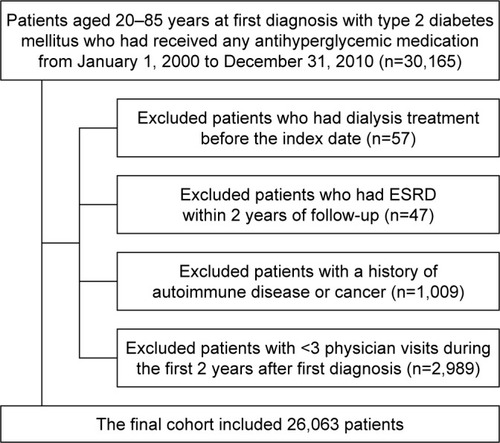
Table 1 Level of continuity of care by patient characteristics before propensity weighting
Figure 2 Level of continuity of care by patient characteristics before and after propensity weighting.
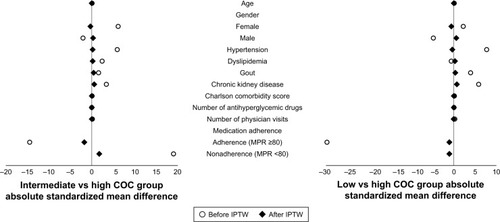
Figure 3 Kaplan–Meier curves showing ESRD survival and hospitalization survival among COC groups.
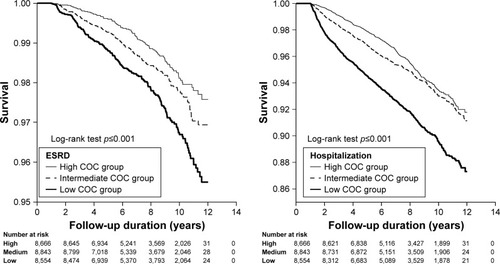
Table 2 Risk of ESRD and hospitalization by level of continuity of care, with adjustment for competing risk of death
Table 3 Interactive effects of hospitalization and COC level on the risk of ESRD
Figure 4 Multivariable stratified analyses for the association between continuity of care and ESRD and hospitalization after propensity weighting.
Abbreviations: COCI, continuity of care index; ESRD, end-stage renal disease; HR, hazard ratio; MPR, medication possession ratio.
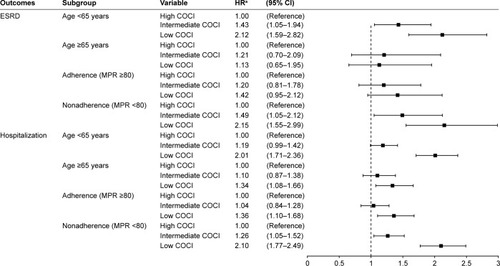
Table S1 ICD-9-CM codes for ACSC admissions and comorbidities
Table S2 Level of continuity of care by patient characteristics after propensity weighting
Table S3 Number of ESRD and hospitalization patients in the high, intermediate, and low COC groups