
Figures & data
Table 1 Comparison of the characteristics of pure GGNs and mixed GGNs
Figure 1 The pulmonary nodule was located by the hookwire insertion.
Notes: Surgical photograph shows hookwire (arrow) traversing pleural space and entering lung parenchyma. The picture was taken in the operating room of Shanghai Pulmonary Hospital.
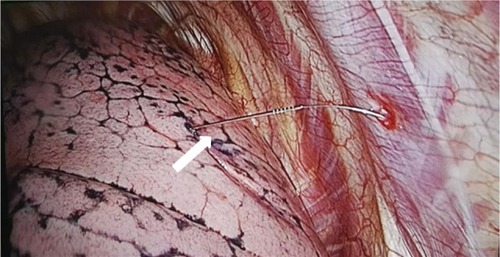
Figure 2 The deep lesion was located by the microcoil on the visceral pleura surface under thoracoscopic guidance.
Note: From Sui X, Zhao H, Yang F, Li JL, Wang J. Computed tomography guided microcoil localization for pulmonary small nodules and ground-glass opacity prior to thoracoscopic resection. J Thorac Dis. 2015;7:1580–1587. With permission from AME Publishing Company.Citation14
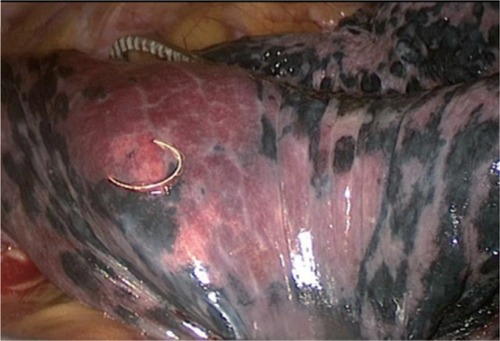
Figure 3 Schematic diagram of “trailing method” for deploying the microcoil.
Notes: (A) The distance between needle tip and outside the parietal pleura was measured and marked on the guide wire; (B) the guide wire was inserted into the needle and advanced to the marked location. The distal part of the microcoil was deployed and coiled in the lung parenchyma; (C) the guide wire was held in place, and the needle was withdrawn slowly. When the needle was withdrawn beyond the parietal pleura, the needle and guide wire were withdrawn simultaneously; (D) the microcoil was deployed with the proximal part coiling beyond the parietal pleura and the distal part anchoring in the lung parenchyma. From Sui X, Zhao H, Yang F, Li JL, Wang J. Computed tomography guided microcoil localization for pulmonary small nodules and ground-glass opacity prior to thoracoscopic resection. J Thorac Dis. 2015;7:1580–1587. With permission from AME Publishing Company.Citation14
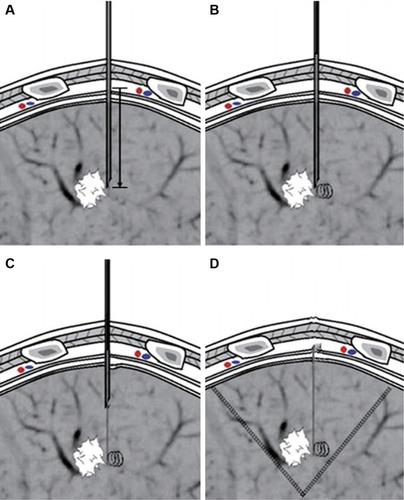
Table 2 Comparison of frozen section and final pathology reveals that most discrepant cases were the underestimation of AIS and MIA