
Figures & data
Figure 1 Study selection flowchart.
Abbreviations: CRC, colorectal cancer; CTC, computed tomography colonography; OC, optical colonoscopy.
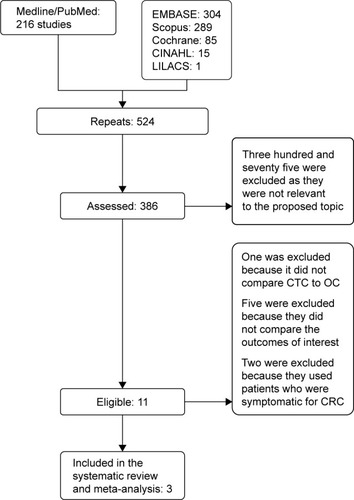
Table 1 Rate of participation
Figure 2 Forest plot: rate of participation.
Abbreviations: CTC, computed tomography colonography; OC, optical colonoscopy.
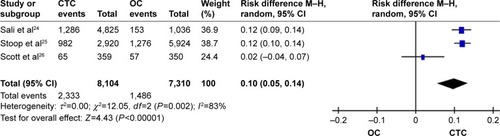
Table 2 Positive test results and follow-up
Table 3 Rate of detection per participant
Figure 3 Forest plot: rate of detection of ACN per participant.
Abbreviations: ACN, advanced colorectal neoplasia; CTC, computed tomography colonography; OC, optical colonoscopy.
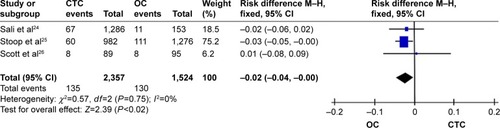
Figure 4 Forest plot: rate of detection of ACN per invitee.
Abbreviations: ACN, advanced colorectal neoplasia; CTC, computed tomography colonography; OC, optical colonoscopy.
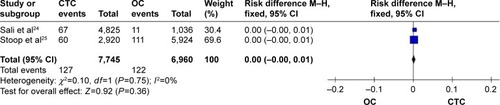
Table 4 Positive predictive value
Table S1 Characteristics of the studies as per the PICOS strategy
Table S2 Quality assessment of all included studies using QUADAS-2
Table S3 Tabular application of results of QUADAS-2 for the included studies
Table S4 Patients