
Figures & data
Figure 1 Schematic drawings.
Notes: a, anteroposterior diameter of the spinal canal; b, ossified thickness of the most stenotic area; c, residual thickness.
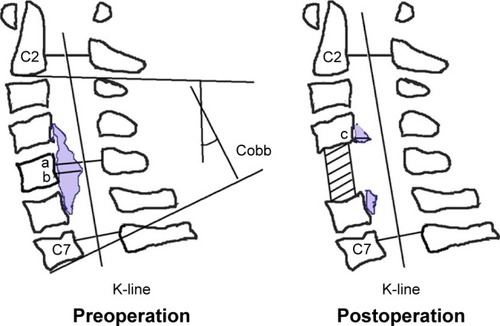
Figure 2 Measuring ossified thickness and high-intensity signal of spinal cord.
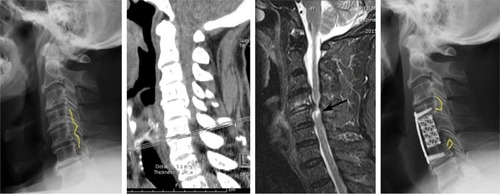
Table 1 Comparison of patient characteristics between good and poor recovery groups
Table 2 Risk factors for poor outcome after operation: multiple logistic regression analysis
Figure 3 In ROC curves, the optimal cutoff values of age, occupying ratio of OPLL, and residual ratio of OPLL were shown for prediction of a poor surgical outcome.
Abbreviations: OPLL, ossification of the posterior longitudinal ligament; ROC, receiver operating characteristic.
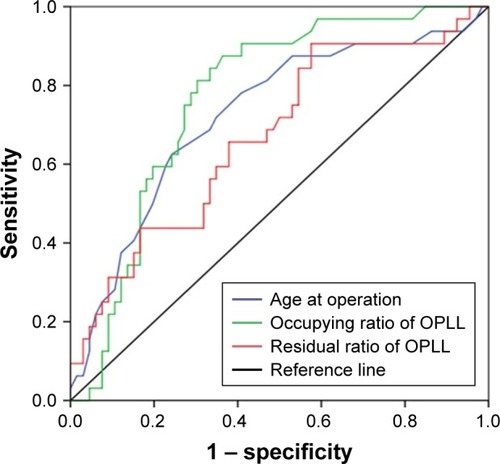
Table 3 Sensitivity, specificity, AUC, and cutoff of risk factors for predicting poor outcome
Table 4 Differences in the incidence of poor outcome in patients with <2 factors and ≥2 factors
Table 5 Comparison of CSF leakage group and no-CSF leakage group during intraoperative