
Figures & data
Figure 1 Flow chart of the study selection process.
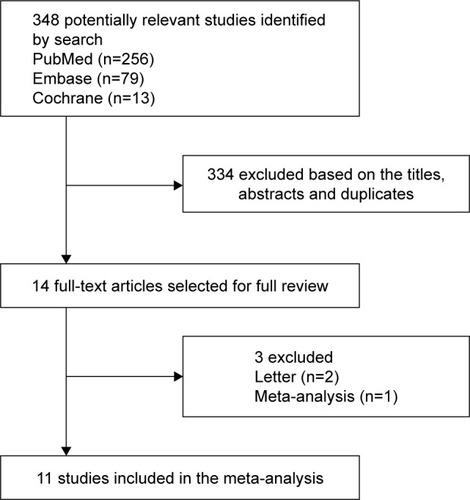
Figure 2 Assessment for risk of bias.
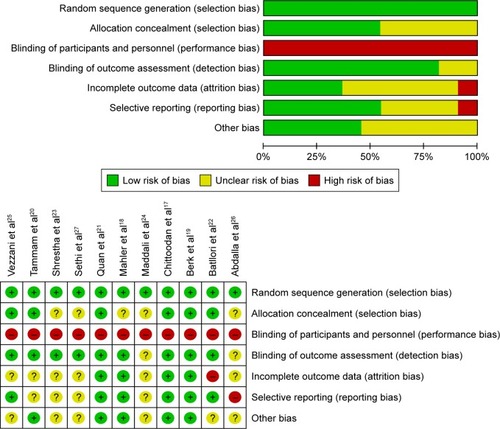
Table 1 Characteristics of the 11 included trials
Figure 3 Forest plot of total success rate.
Abbreviation: M–H, Mantel–Haenszel.
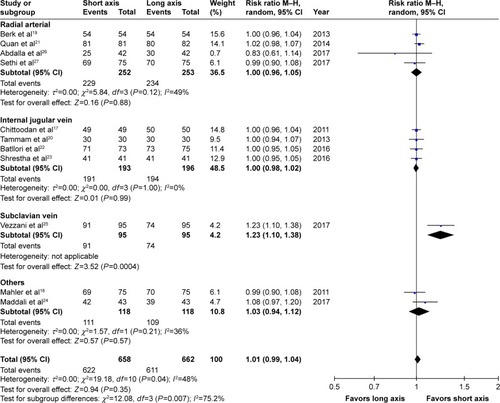
Figure 4 TSA result.
Notes: (A) RA subgroup. The DL approach of TSA used for the total success rate. A diversity-adjusted information size of 595 participants was calculated on the basis of a total success rate of 92.5% in the long-axis group with a relative risk reduction of 10%, α=5% (two sided), β=10% (power 90%), and I2=0%. The solid blue line represents a cumulative Z-curve, which crossed the futility boundary (complete red line) and reached the futility area. (B) IJV subgroup. The DL approach of TSA was used for the total success rate. A diversity-adjusted information size of 240 participants was calculated on the basis of a total success rate of 99% in the long-axis group with a relative risk reduction of 10%, α=5% (two sided), β=10% (power 90%), and I2=0%. The complete blue line represents the cumulative Z-curve, which entered the futility area and crossed the required information size boundary.
Abbreviations: DL, DerSimonian–Laird; IJV, internal jugular vein; M–H, Mantel–Haenszel; RA, radial artery; TSA, trial sequential analysis.
Abbreviations: DL, DerSimonian–Laird; IJV, internal jugular vein; M–H, Mantel–Haenszel; RA, radial artery; TSA, trial sequential analysis.
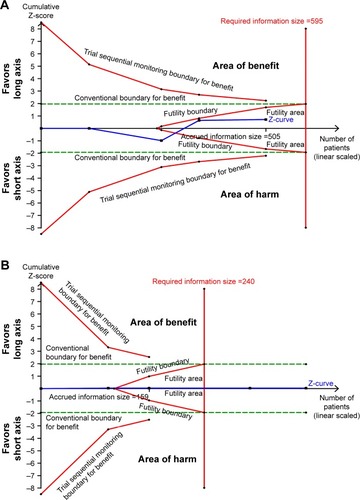
Figure 5 Forest plot of the first attempt success rate.
Abbreviation: M–H, Mantel–Haenszel.
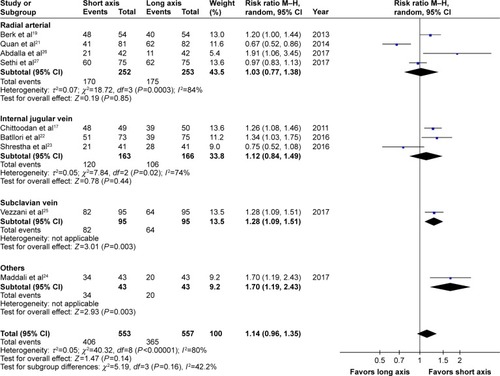
Table 2 Secondary outcomes