
Figures & data
Table 1 Results of the questionnaire survey and medical interview pre- to postintervention
Table 2 Periodontal disease tests and bacterial quantities, amount of change from pre- to postintervention
Table 3 Amount of change in body weight and blood test results from pre- to postintervention
Table 4 Amount of change in body weight and blood tests from pre- to postintervention
Figure 1 Pearson’s product–moment correlation coefficient between the change in periodontal tests and the copy count of Treponema denticola. (A) Correlation between the change in the copy count of T. denticola and the median percentage of the number of teeth with PPD ≥4 mm (correlation coefficient r=0.417, significant difference P=0.003). (B) Correlation between the change in the copy count of T. denticola and the median percentage of teeth with BOP (correlation coefficient r=0.362, significant difference P=0.010).
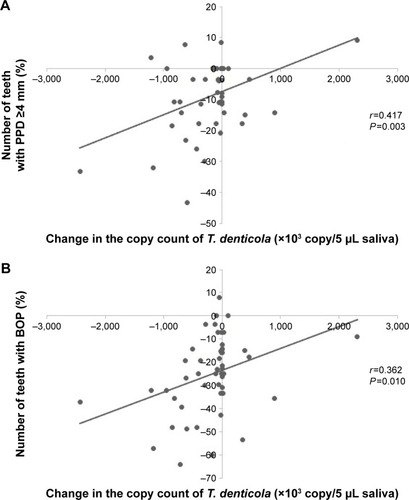
Figure 2 Pearson’s product–moment correlation coefficient between the change in body weight and blood tests and the copy count of Treponema denticola. (A) Correlation between the change in the copy count of T. denticola and the change in body weight (correlation coefficient r=0.373, significant difference P=0.008). (B) Correlation between the change in the copy count of T. denticola and the change in LDL-C (correlation coefficient r=0.282, significant difference P=0.049). (C) Correlation between the change in the copy count of T. denticola and the change in fasting insulin (correlation coefficient r=0.293, significant difference P=0.041).
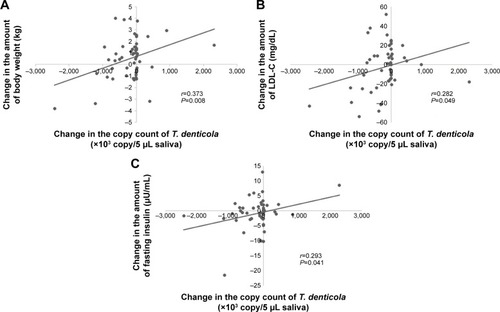
Table 5 Correlation between change in the copy count of periodontal disease-causing bacteria and body weight, blood test results
Table 6 Correlation between change in the copy count of periodontal disease-causing bacteria and body weight, blood test results