
Figures & data
Figure 1 CONSORT 2010 flow diagram.
Abbreviations: CVP, central venous pressure; SVV, stroke volume variation.
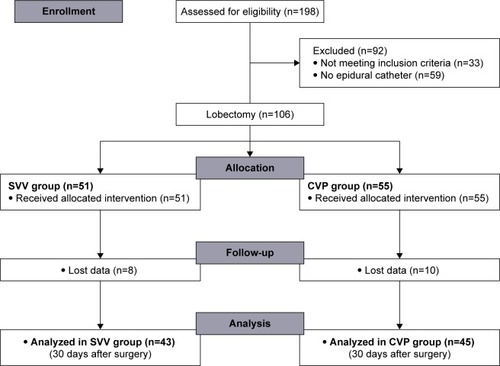
Table 1 Demographic characteristics of patients
Table 2 Intraoperative baseline values of patients
Table 3 Postoperative values of patients
Table 4 Hemodynamic parameters of the SVV group
Table 5 Intraoperative values of patients
Table 6 Postoperative complications