
Figures & data
Figure 1 Selection of the study population.
Abbreviations: FPG, fasting plasma glucose; PG, postprandial glucose; HbA1c, hemoglobin A1c.
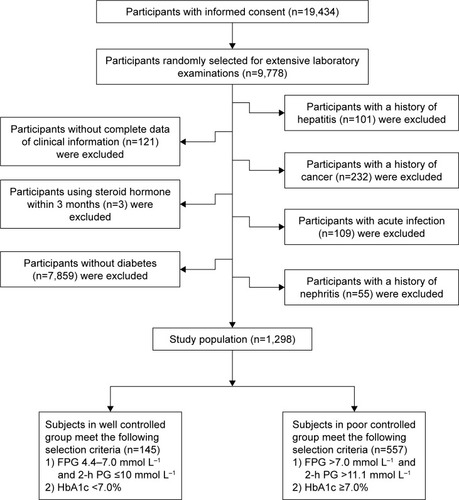
Table 1 Distribution of risk factors in relation to glycemic control status
Table 2 Distribution of risk factors in relation to RDW
Table 3 Binary logistic regression models evaluating the association of RDW with the risk of being in poor glycemic control
Table 4 Odds ratio with 95% confidence intervals for glycemic control in quartiles of RDW according to tertiles of BMI, TC, HDL-C and LDL-C