
Figures & data
Figure 1 Flow diagram of the selection process.
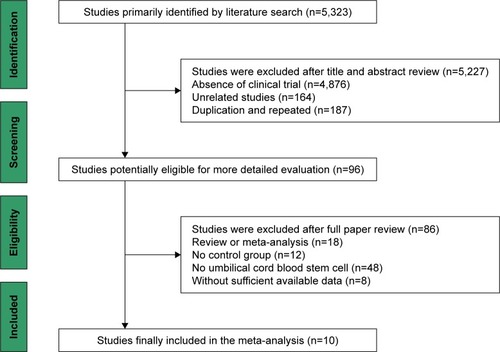
Table 1 Clinical information from the eligible trials in the meta-analysis
Table 2 Information of USCs therapy
Figure 2 (A) Risk of bias summary: review of authors’ judgments about each risk of bias item for the included studies. (B) Risk of bias graph: review of authors’ judgments about each risk of bias item presented as percentages across all the included studies. Each color represents a different level of bias: red for high risk, green for low risk and yellow for unclear risk of bias.
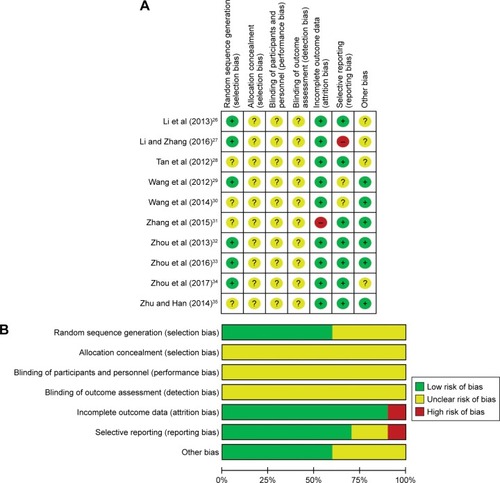
Figure 3 Forest plot of the comparison of TBIL (A), ALB (B), ALT (C), AST (D), PT (E) and PTA (F) in pre- and post-therapy.
Abbreviations: IV, inverse variance method; TBIL, total bilirubin; ALB, albumin; ALT, alanine aminotransferase; AST, aspartate aminotransferase; PT, prothrombin time; PTA, prothrombin activity.
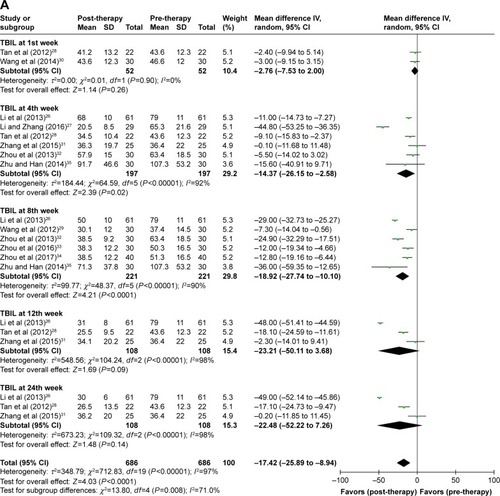
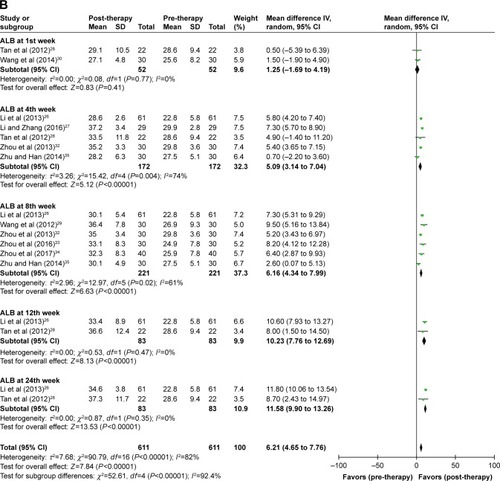
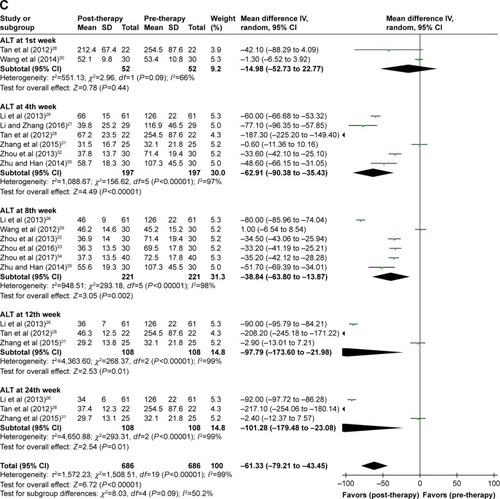
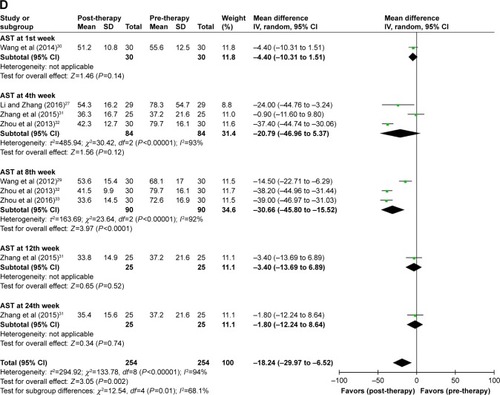
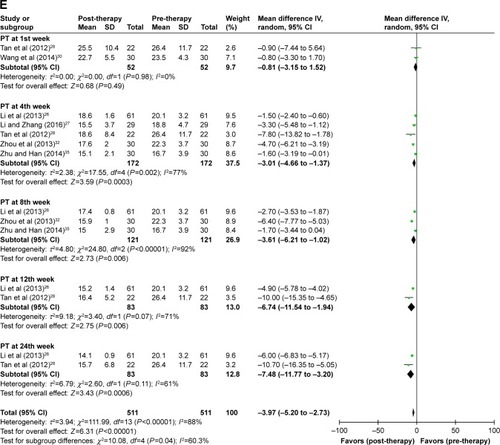
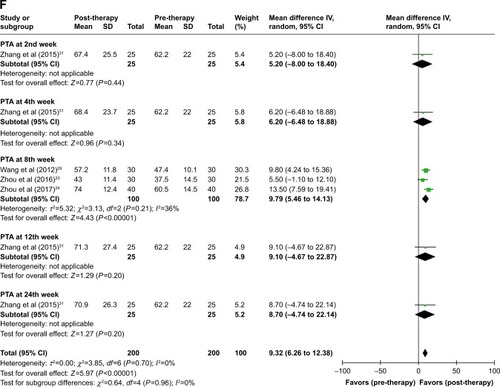
Figure 4 Forest plot of the comparison of QoL including fatigue (A), appetite (B), abdominal distension (C), ascitic fluid (D) and edema (E) between the experimental and control groups.
Abbreviations: M–H, Mantel–Haenszel method; QoL, quality of life; USCs, umbilical cord blood stem cells; RST, routine supportive treatment.
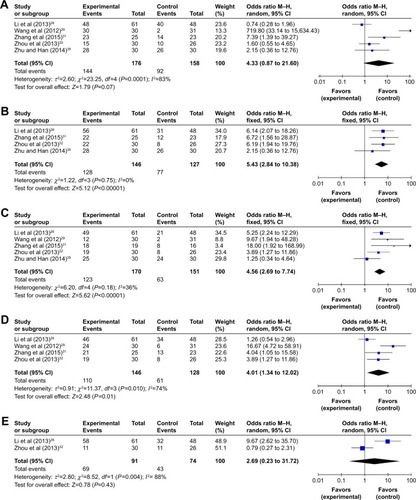
Table 3 Information of adverse events during the USCs therapy
Figure 5 Funnel plot of percentage of TBIL (A), ALB (B), ALT (C) and PT (D) in pre- and post-therapy.
Abbreviations: TBIL, total bilirubin; ALB, albumin; ALT, alanine aminotransferase; PT, prothrombin time.
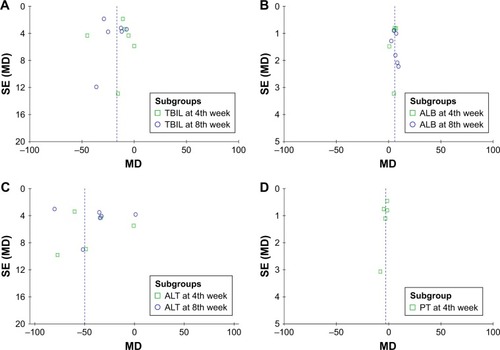
Table 4 Subgroup analyses of TBIL, ALB, ALT and PT in pre- and post-therapy
Figure S1 Forest plot of the comparison of TBIL (A), ALB (B), ALT (C), AST (D), PT (E) and PTA (F) between the experimental and control groups.
Notes: Control group, RST alone group; experimental group, RST plus USCs therapy.
Abbreviations: IV, inverse variance method; TBIL, total bilirubin; ALB, albumin; ALT, alanine aminotransferase; AST, aspartate aminotransferase; PT, prothrombin time; PTA, prothrombin activity; USCs, umbilical cord blood stem cells; RST, routine supportive treatment.
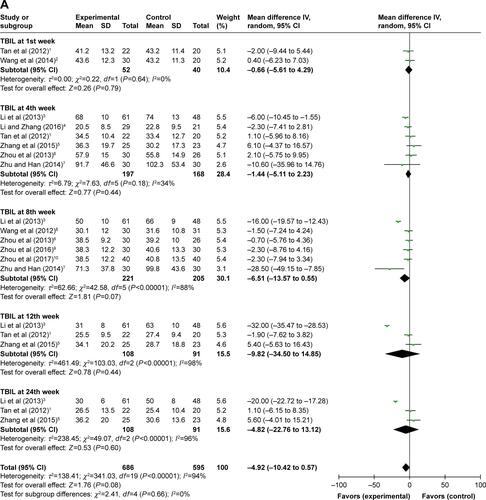
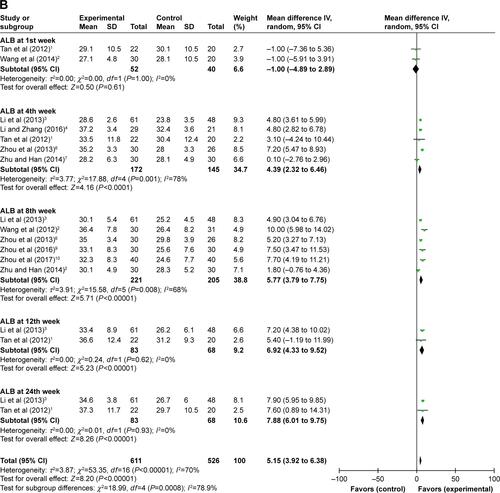
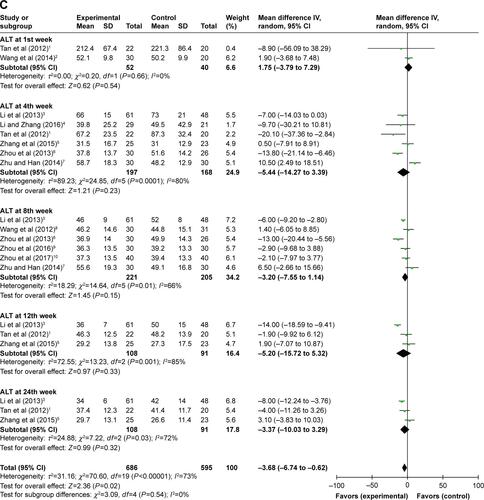
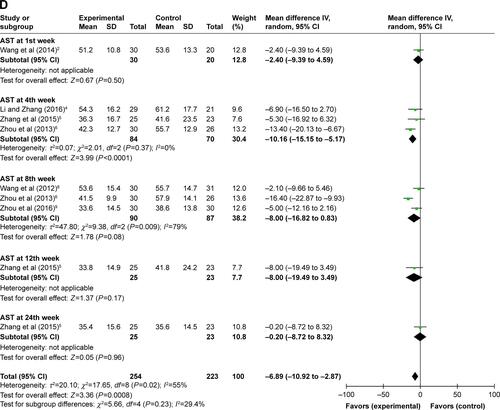
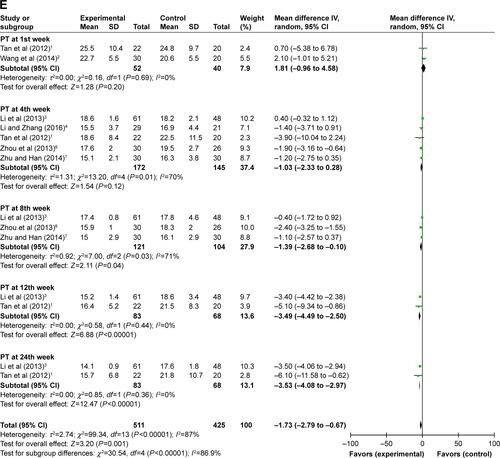
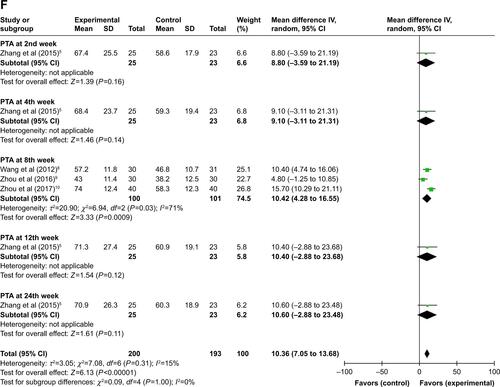
Figure S2 Funnel plot of percentage of total bilirubin (TBIL, A), albumin (ALB, B), alanine aminotransferase (ALT, C) and prothrombin time (PT, D) between the experimental and control groups.
Notes: Subgroup analyses were conducted in parameters discussed in >6 papers. Control group, routine supportive therapy alone group; experimental group, RST plus umbilical cord blood stem cell therapy.
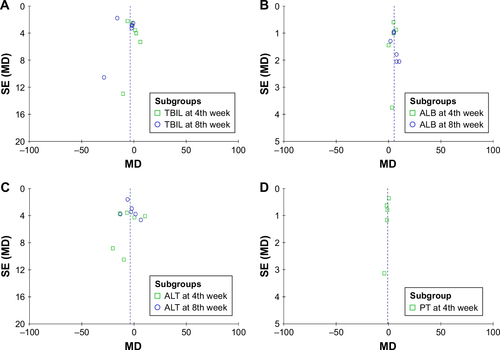
Table S1 Subgroup analyses of TBIL, ALB, ALT and PT between the experimental and control groups