
Figures & data
Figure 1 Chest X ray of a patient with CEP demonstrating peripheral opacities.
Abbreviation: CEP, chronic eosinophilic pneumonia.
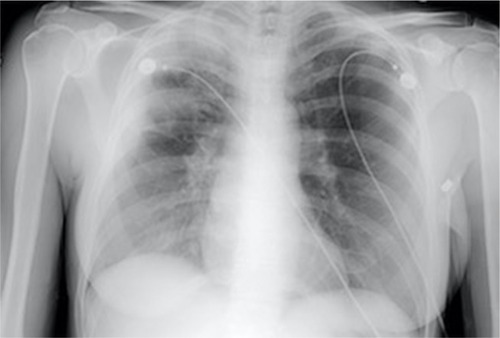
Figure 2 CT coronal view of a patient with CEP demonstrating peripheral consolidation, with alveolar opacities asymmetrically more in the right upper lobe.
Abbreviation: CEP, chronic eosinophilic pneumonia.
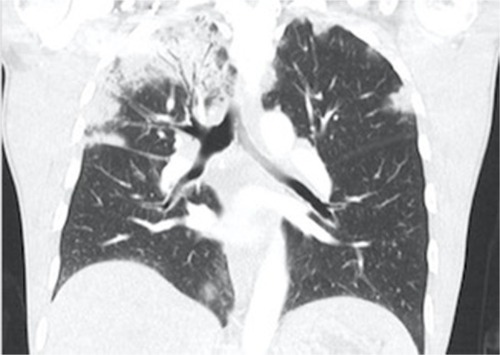
Figure 3 CT axial view in the same patient demonstrating the right-sided pleural based consolidation.
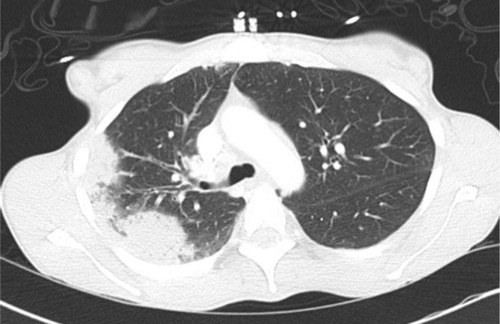
Figure 4 Histopathology features of chronic eosinophilic pneumonia.
Notes: Alveolar spaces are filled with fibrinous exudate and numerous eosinophils (arrow). Eosinophils and macrophages infiltrate the interstitium (arrow head). H&E stain, ×200.
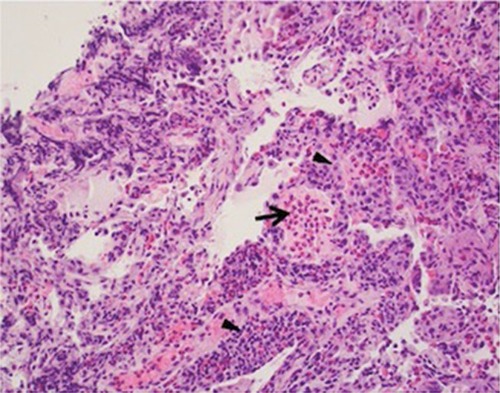
Table 1 CEP diagnostic criteria