
Figures & data
Figure 1 Flow chart of the study.
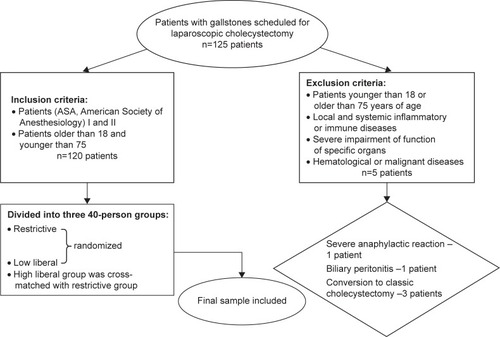
Table 1 Baseline demographics, anesthesiologic, and surgical data
Figure 2 Box-whisker diagram representing the dynamic changes of SAP (A), DAP (B), MAP (C) and HR (D) before induction of anesthesia (□), immediately after intubation (<img>), when pneumoperitoneum was created (||), and immediately after surgery (═) in the restrictive, low liberal, and high liberal groups.
Abbreviations: SAP, systolic blood pressure; DAP, diastolic blood pressure; MAP, mean arterial pressure; HR, heart rate.
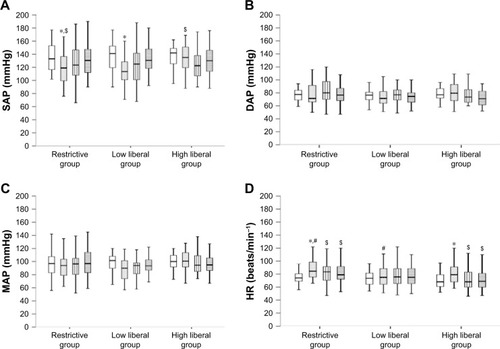
Figure 3 Box-whisker diagram representing the dynamic changes of the cardiac index (CI) (A), SVI (B), and SVRI (C) before induction of anesthesia (□), immediately after intubation (), when the pneumoperitoneum was created (||), and immediately after surgery (═) in the restrictive, low liberal, and high liberal groups.
Abbreviations: CI, cardiac index; SVI, stroke volume index; SVRI, systemic vascular resistance index.
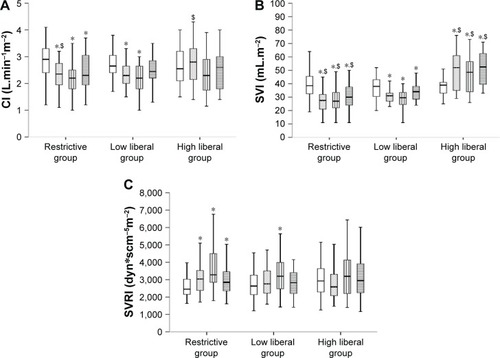
Table 2 Laboratory data of arterial blood gas values and lactate concentrations at four time points
Table 3 Simplified Acute Physiology Score (SAPS) and estimated mortality (%)