
Figures & data
Figure 1 Flow chart for subject recruitment, enrollment and group assignment.
Abbreviations: EABCF, extruded adzuki bean convenient food; FBG, fasting blood glucose; HbA1c, glycosylated hemoglobin; LGI, low glycemic index.
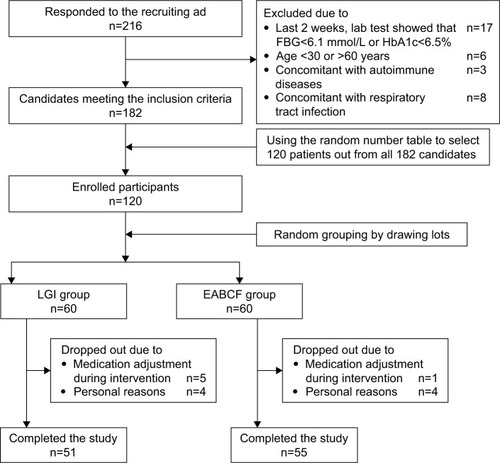
Table 1 Nutritional components, specifications and directions for the extruded red adzuki bean convenient food
Table 2 Characteristics of the participants at baseline
Table 3 Daily energy and nutrient intakes of the participants during the study period
Table 4 Changes in metabolic parameters of participants during the study period
Table 5 The subgroup analysis of the homeostasis model assessment (HOMA) based on the different serum insulin levels at baseline for the participants who were not treated with exogenous insulin
Table 6 Intervention consumption statistics