Figures & data
Figure 1 Flow diagram of the study selection process.
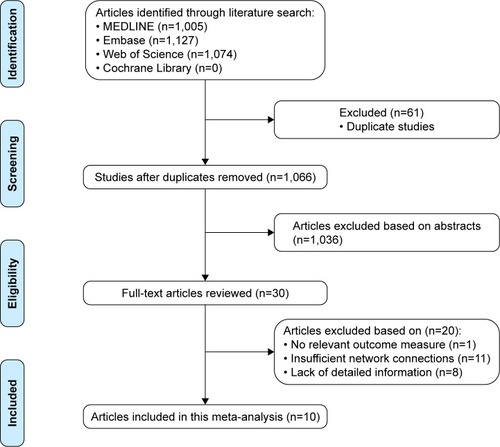
Figure 2 Risk of bias of the included randomized controlled trials (judgments about each risk-of-bias item for each included study: +, low risk; −, high risk; ?, unclear risk).
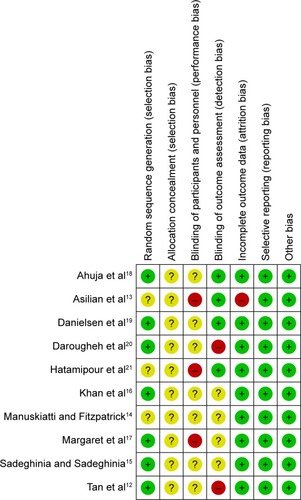
Figure 3 Network of randomized controlled trials comparing different adjuvant therapies for keloid treatment.
Notes: The thickness of the connecting lines represents the number of trials between each comparator, and the size of each node corresponds to the number of subjects who received the same pharmacological agent (sample size). (A: TAC; B: placebo; C: PDL; D: 5-FU; E: silicone; F: verapamil; G: TAC+5-FU; H: TAC+5-FU+PDL).
Abbreviations: TAC, triamcinolone acetonide; PDL, pulsed dye laser; 5-FU, 5-fluorouracil.
Abbreviations: TAC, triamcinolone acetonide; PDL, pulsed dye laser; 5-FU, 5-fluorouracil.
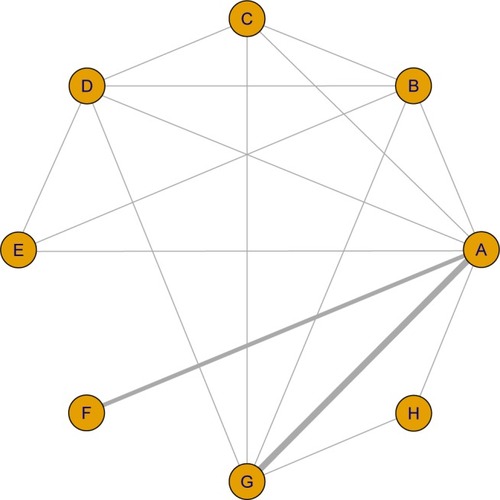
Table 1 Characteristics of included studies
Table 2 Summary ORs of TAC and heterogeneity for each direct comparison
Table 3 Network meta-analysis comparisons
Figure 4 SUCRA values, expressed as percentages, ranking the therapeutic effects and safety of treatments for keloids.
Notes: For efficacy and safety assessment, the pharmacological agent with the highest SUCRA value would be the most efficacious and safe treatment (A: TAC; B: placebo; C: PDL; D: 5-FU; E: silicone; F: verapamil; G: TAC+5-FU; H: TAC+5-FU+PDL).
Abbreviations: SUCRA, surface under the cumulative ranking curve; TAC, triamcinolone acetonide; PDL, pulsed dye laser; 5-FU, 5-fluorouracil.
Abbreviations: SUCRA, surface under the cumulative ranking curve; TAC, triamcinolone acetonide; PDL, pulsed dye laser; 5-FU, 5-fluorouracil.
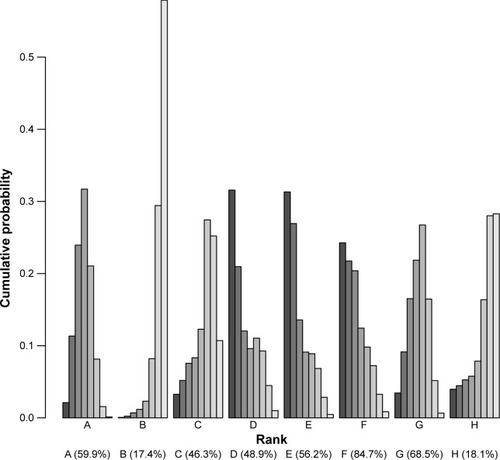
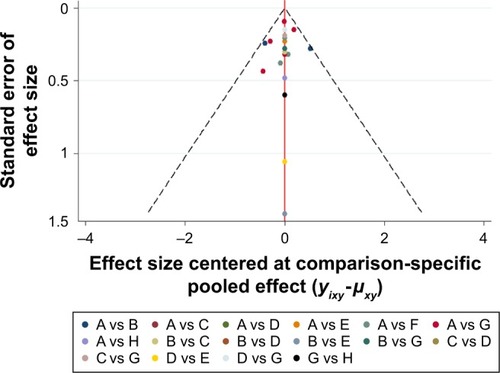
Figure 5 Comparison-adjusted funnel plot for the network meta-analysis.
Notes: The red line suggests the null hypothesis that the study-specific effect sizes do not differ from the respective comparison-specific pooled effect estimates. Different colors represent different comparisons (A: TAC; B: placebo; C: PDL; D: 5-FU; E: silicone; F: verapamil; G: TAC+5-FU; H: TAC+5-FU+PDL).
Abbreviations: TAC, triamcinolone acetonide; PDL, pulsed dye laser; 5-FU, 5-fluorouracil.
Abbreviations: TAC, triamcinolone acetonide; PDL, pulsed dye laser; 5-FU, 5-fluorouracil.