
Figures & data
Figure 1 Percentage changes in lumbar BMD (A) and total hip BMD (B) before, and at 6–8, 12, 18, and 24 months after denosumab therapy.
Note: Patient 2 was followed up for 18 months, not 24 months.
Abbreviations: BMD, bone mineral density; M, months.
Abbreviations: BMD, bone mineral density; M, months.
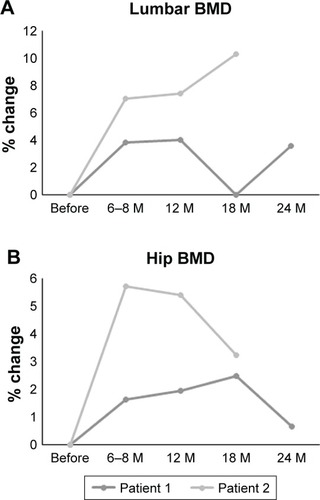
Figure 2 Percentage changes in BAP (A), urinary NTX (B), serum TRACP-5b (C), and active form of vitamin D or 1,25(OH)2D3 (D) before, and at 1, 4, 8, 12, 18, and 24 months after denosumab therapy.
Note: Patient 2 was followed up for 18 months, not 24 months.
Abbreviations: BAP, bone alkaline phosphatase; NTX, cross-linked N-terminal telopeptides of type I collagen; TRACP-5, tartrate-resistant acid phosphatase 5b; M, months.
Abbreviations: BAP, bone alkaline phosphatase; NTX, cross-linked N-terminal telopeptides of type I collagen; TRACP-5, tartrate-resistant acid phosphatase 5b; M, months.
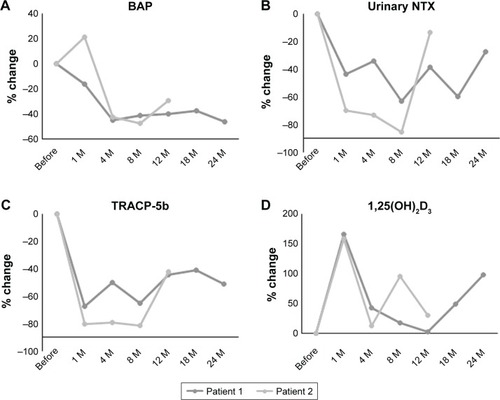
Table 1 Patient laboratory data
Table 2 Patient bone mineral density
Table 3 Patient laboratory data (bone metabolism markers)