Figures & data
Table 1 Baseline characteristics of studies included in the network meta-analysis
Figure 1 Flow chart diagram of searching strategy.
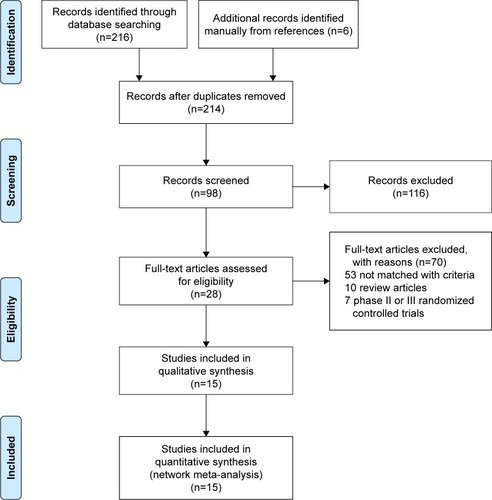
Figure 2 Risk of bias.
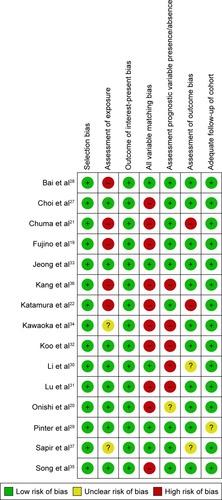
Figure 3 Comparisons of efficacy in terms of disease control rate in advanced HCC scheme.
Note: The numbers in bold indicate OR and 95% CI are significant.
Abbreviations: HAIC, hepatic arterial infusion chemotherapy; OR, odds ratio; SBRT, stereotactic body radiotherapy; TACE, transarterial chemoembolization; RT, radiotherapy.
Abbreviations: HAIC, hepatic arterial infusion chemotherapy; OR, odds ratio; SBRT, stereotactic body radiotherapy; TACE, transarterial chemoembolization; RT, radiotherapy.
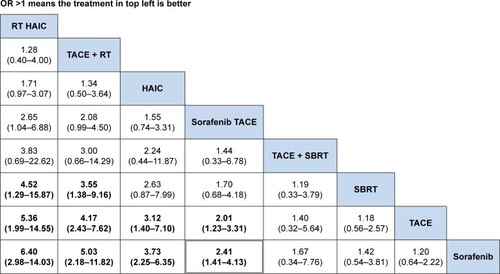
Figure 4 Comparisons of efficacy in terms of median OS in advanced HCC.
Note: The numbers in bold indicate OR and 95% CI are significant.
Abbreviations: HAIC, hepatic arterial infusion chemotherapy; OR, odds ratio; OS, overall survival; SBRT, stereotactic body radiotherapy; TACE, transarterial chemoembolization; RT, radiotherapy.
Abbreviations: HAIC, hepatic arterial infusion chemotherapy; OR, odds ratio; OS, overall survival; SBRT, stereotactic body radiotherapy; TACE, transarterial chemoembolization; RT, radiotherapy.
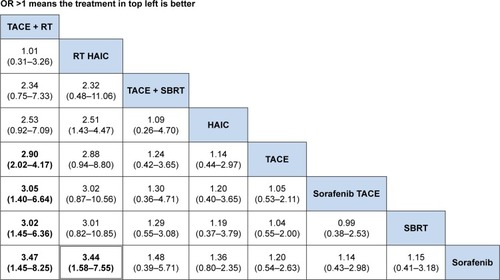
Figure 5 Rankogram of interested treatment modality.
Abbreviations: HAIC, hepatic arterial infusion chemotherapy; SBRT, stereotactic body radiotherapy; TACE, transarterial chemoembolization; RT, radiotherapy.
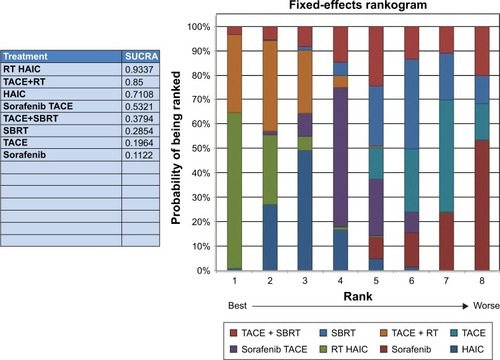
Figure 6 Comparison of adverse events for regimens in advanced HCC OR (95% CI).
Note: The numbers in bold indicate OR and 95% CI are significant.
Abbreviations: CI, confidence interval; HAIC, hepatic arterial infusion chemotherapy; OR, odds ratio; SBRT, stereotactic body radiotherapy; TACE, transarterial chemoembolization; RT, radiotherapy.
Abbreviations: CI, confidence interval; HAIC, hepatic arterial infusion chemotherapy; OR, odds ratio; SBRT, stereotactic body radiotherapy; TACE, transarterial chemoembolization; RT, radiotherapy.
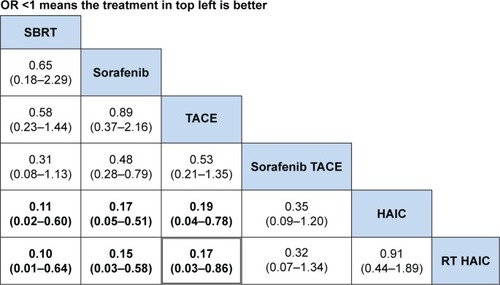
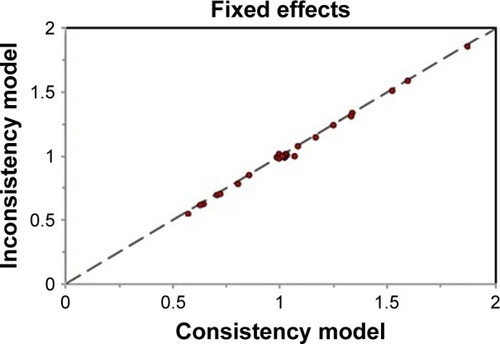
Figure 7 Network inconsistency assessment in fix-effect model.