
Figures & data
Figure 1 Trends in the count of scholarly publications related to rehabilitation of spinal cord injury from 1997 to 2016.
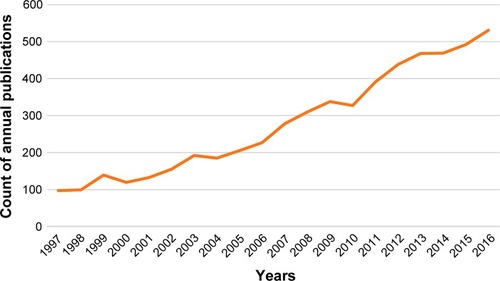
Table 1 The top 10 active journals that published literature on rehabilitation of spinal cord injury research from 1997 to 2016
Figure 2 Maps of references cited by the literature on rehabilitation of spinal cord injury from 1997 to 2016 and maps of the cited journals that published the references. (A) Co-citation network map of cited journals. (B) Cluster map of cited journals. (C) Co-citation network map of references. (D) Cluster map of references. The smaller the number, the more nodes the clustering contains.
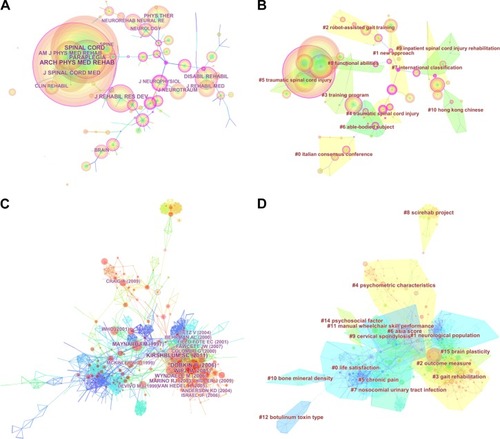
Figure 3 Maps of researchers who published literature on rehabilitation of spinal cord injury from 1997 to 2016. (A) Co-authorship map of authors. (B) Cluster map of authors. (C) Co-authorship map of institutions. (D) Cluster map of institutions. (E) Co-authorship map of countries. The smaller the number, the more nodes the clustering contains.
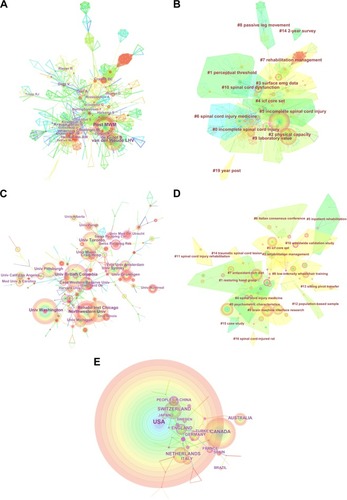
Figure 4 Citation history of the top authors, top institutions, and top countries that published literature on rehabilitation of spinal cord injury from 1997 to 2016.
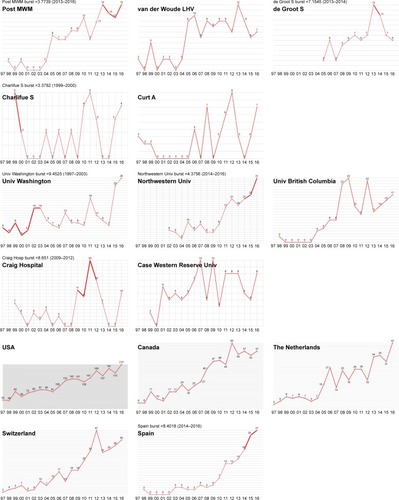
Table 2 The top 10 active authors who published literature on rehabilitation of spinal cord injury research from 1997 to 2016
Table 3 The top 10 active institutions and countries that published literature on rehabilitation of spinal cord injury research from 1997 to 2016
Table 4 The largest 10 clusters of the references co-citation network
Table 5 The top 10 active references cited by the literature on rehabilitation of spinal cord injury from 1997 to 2016
Figure 5 Maps of keyword co-occurrence and term co-occurrence in literature on rehabilitation of spinal cord injury from 1997 to 2016. (A) The keyword co-occurrence network map. (B) The keyword co-occurrence cluster map. (C) The keyword co-occurrence cluster map in timeline view. (D) The term co-occurrence cluster map. The smaller the number, the more nodes the clustering contains.
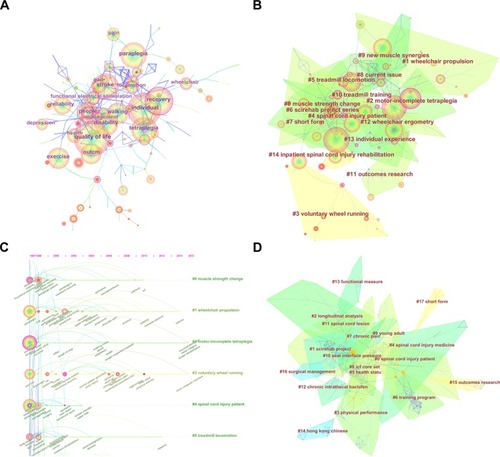
Table 6 The largest 10 clusters of the keyword co-occurrence network
Table 7 The largest 10 clusters of the term co-occurrence network