
Figures & data
Table 1 General characteristics of all patients
Table 2 Subgroup analysis between 4 groups divided by type of surgery
Figure 1 The change in the trend of surgery type for RCC in Taiwan from 2006 to 2012.
Abbreviations: PN, partial nephrectomy; RCC, renal cell carcinoma; RN, radical nephrectomy.
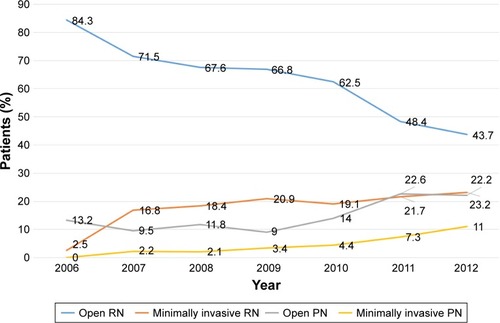
Table 3 Bleeding-related complications and opioid analgesics consumption in all 4 groups